What is observed when an unconventional well is fractured is often at odds with what was expected by those who planned the job.
In-well observations from technical papers from Shell (SPE 179124) and Devon Energy (SPE 179149) presented at the recent SPE Hydraulic Fracturing Technology Conference question many of the assumptions made about how to most efficiently stimulate nearly impermeable unconventional formations.
Completion designs often assume that adding perforations will increase the number of productive fractures. But Shell’s in-well studies using a fiber-optic cable during and after completions showed that in most stages only one fracture, and sometimes two, take in most of the fluid and sand. The company also found that more stimulation translates into more production.
“There is invariably a dominant perforation stage emerging through the jobs,” said Bill Wheaton, formerly a senior adviser in operations engineering for Devon who presented its paper. “We would like to see four [effective] fractures for four perforation clusters, but that is an uncommon thing,” he said.
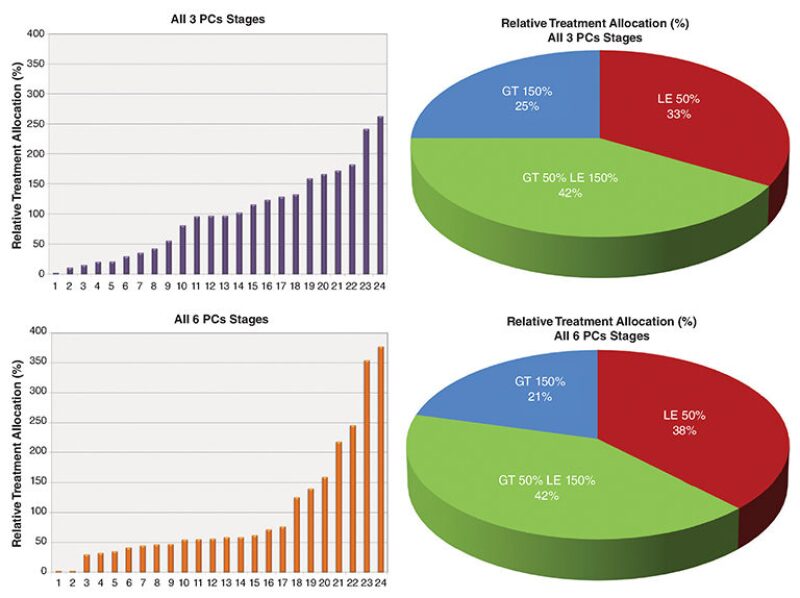
Generally, the most productive spot in each cluster of perforations is located on the heelward side—the end toward the section of the well that curves from horizontal to vertical. Both papers showed wide variations in how much fluid and proppant flowed into the formation at different spots along the studied wellbores. In the Shell study, more than two-thirds of all the clusters took in 50% more or less than the designed amount.
And the tools used to control the flow during fracturing often leak. Packers frequently fail to seal stages, allowing large amounts of fluid and proppant to escape, and diverters often are unable to temporarily clog large fractures so the hydraulic pressure can be redirected to stimulate small ones.
“We need to pay attention not only to the design but the execution,” said Gustavo Ugueto, senior staff petrophysical engineer for Shell, during his presentation at the fracturing conference. Measures of what flows into the perforations show that “a lot of them receive more than designed for, and a lot receive less.”
Fracturing Efficiency
There is an upside to these critical reports—addressing the problems could lead to revised methods and tools that could produce more oil and gas with less.
Shell’s paper sets that theme by quoting its paper about fracturing from 1963 (SPE 530) that said, “The basic objective of all well treatment is to get the best stimulation compatible with the cost.”
Both Shell and Devon’s papers conclude that spending more to add clusters of explosive charges that increase the entry points for hydraulic fracturing is likely to be a costly way to boost production. “Increasing perforation clusters seems to promote ineffective perforation clusters,” Wheaton said, suggesting, “We should be considering more stages and fewer clusters.”
While those papers compared completions with 3–6 clusters of perforations per stage—Devon’s clusters each had 5 charges and were 1–2 ft long—some operators are using more than 10 closely spaced clusters per stage.
Frequently, increasing perforation clusters seemed to increase the propensity for development of a single dominant fracture, the Devon study concluded, adding: “Stages with fewer perf clusters were more likely to develop at least two fractures close to equal treatment distribution and geometry.”
“The less clusters per stage you have, the greater the efficiency,” Ugueto said.
Studies showing the value of stimulating a limited number of perforations goes back more than 50 years to work by Shell engineers at Venezuela’s Lake Maracaibo (SPE 1415). They found that they could produce more by switching from using many perforations per foot, or pre-perforated liners, to 11 perforations for the well, which the paper called “pin-point sand-fracturing.”
Focusing the limited pressure available from their pumps on fewer perforations ensured that there was enough force to consistently initiate a fracture, reduced the perforation cost by 70%, and increased the production rate 95%, compared with results prior to the change. That saved USD 3,700 per well back in 1960, according to the paper.
Now the financial stakes are far higher and the issues observed more complex. Shell reported in the 2016 paper that in its unconventional wells “typically there is enough pressure initially to initiate fractures,” but sustaining that flow can be a problem.
Specifically, the fiber-optic cable wrapped around the outside of the production casing observed areas a few meters across where the cooler water from the surface reduced the temperature of the surrounding rock, indicating that some of the fluid had gotten into the formation. But the cooling was relatively short-lived, and the rock warmed back up quickly, indicating the volume of the fracture stimulated was small compared with super clusters where the temperature effect was greater and longer lasting.
Normally, fractures begin forming near the heel of the stage as water is injected. But as pumping continues, clusters near the heel begin to dominate, while many farther down the hole go into decline. Pressure drops during pumping can result in the loss of one or more active clusters, and once lost they do not tend to come back again.
Meanwhile, dominant clusters are changed by the strong flows of water and abrasive sand, which widen the diameter of the opening. “Inefficient clusters appear to stop taking treatment, resulting in others in the same stage taking significantly larger volumes than planned,” the Shell paper said.
Spotty Results
The sample of data available from the wells observed using the fiber-optic tool is small. Few companies have been willing to pay to install the tool and develop the expertise needed to process and analyze the massive amounts of data these systems generate, which is an emerging technology. Shell and Devon’s papers suggest what operators do not know could be costly.
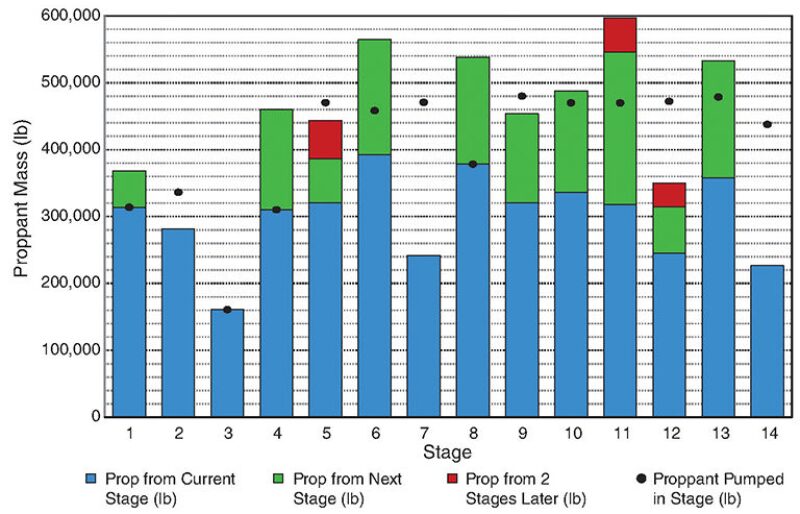
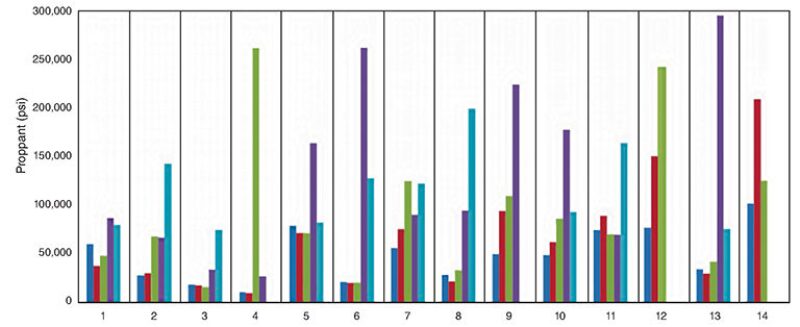
A table from Devon’s paper shows that in a well with four perforation clusters per stage, one of the two on the heelward side was dominant in 13 of the 14 stages. In most stages there is a wide gap between the fluid flowing into the top fractures and what flows into the rest.
Devon observed that the low-performing clusters likely were a result of the stress added to the formation when a large fracture is stimulated, which is capable of stunting the growth of several later fractures.
“Interference between adjacent fractures within a given stage, and from adjacent fracture stages, results in … predominance for fracture growth in the most heel-ward perforation cluster,” the Devon paper said. It said fewer, more widely spaced perforations could limit that effect.
The study found that in 14 stages observed, only one took in all that was pumped, while the others were either getting significantly more or less.
Based on the sound measured by the fiber-optic cable, Shell also measured the production by stage. The dominant fractures, based on the level of treatment, also produced the most hydrocarbons, Ugueto said.
There are downsides to dominance. With so much fluid going into so few fractures, Devon’s fracturing model showed that the dominant fractures were well-propped near the wellbore before pumping was complete. Further stimulation would add little in the planned production zone, and could lead to undesirable growth by the dominant fracture that can hit other wells and disrupt production, or produce from areas that are supposed to be drained by the other wells.
Flow Control
Less perforations is more efficient, but it can also mean less production. Both papers offered examples of stages with as few as three perforations per stage, which the Shell paper concluded was more efficient than six perforations. But with so many poorly fractured perforations, eliminating many of them could also reduce total production, which is not the goal.
One tool for improved output is more effectively containing and controlling fluid flows during fracturing.
Packers used to maintain pressure within one stage during fracture often leak, reducing the pressure at the stage being treated. “We need to improve stage isolation with plugs that actually work and ensure annular isolation,” Ugueto said.
Devon’s paper reported that the acoustic fiber-optic data indicated that more than 70% of the stages showed evidence of “intra-stage communication,” most of which it attributed to plug leakage. Losses of up to half the proppant pumped were observed, and there were instances where the leaked fluid traveled to two previously fractured stages.
Another problem was the materials used to divert the flow away from dominant fractures. Devon planned to stop, or limit, the flow into any dominant perforations by pumping a diverter between three sand ramps.
Surface pressure readings rose, suggesting the diverter was increasing the pressure on poorly fractured locations. But the fiber-optic tool presented a different picture. It showed that once a dominant fracture was established in a given stage, it remained dominant even if the diverter was deployed, the Devon paper said. It said these observations are “not a reason to eliminate” the use of diverters but does point to the need to work on how to use them more effectively.
“Diverter response was inconsistent,” Wheaton said. “I think diverters are important to the oil and gas business, but with the practices and diverter we used on this job, we didn’t see a consistent response.”
Winners and LosersEdited observations on two typical stages by Shell. (SPE 179124)
|
For Further Reading
SPE 530 A New Development in Completion Methods—The Limited Entry Technique by K.W. Lagrone and J.W. Rasmussen, Shell.
SPE 1415 Pin-Point Sandfracturing—A Method for Simultaneous Injection into Multiple Sands by W.B. Murphy and A.H. Juch, Shell.
SPE 179124 Perforation Cluster Efficiency of Cemented Plug and Perf Limited Entry Completions: Insights from Fiber Optics Diagnostics by G. Ugueto, M. Molenaar, B. Wyker, Shell, et al.
SPE 179149 A Case Study of Completion Effectiveness in the Eagle Ford Shale Using DAS/DTS Observations and Hydraulic Fracturing Modeling by B. Wheaton, K. Haustveit, W. Deeg, Devon Energy, et al.