
The ultimate performance of fractured wells in tight reservoirs is affected severely by the interfering effects inside the fracture and interfractures. The most important parameters for determining the optimum fracture length have been shown to be the formation permeability and the stimulated reservoir volume. Although studies have examined the performance of horizontal fractured wells and the fracture-geometry effect, fracture spacing and intersecting angles in vertical and horizontal wells should be investigated further. This study presents the results of a tight-oil-reservoir analogy.
Introduction
An efficient way to improve the productivity of ultratight shale formations is to increase the density of hydraulic fractures. Decreasing hydraulic-fracture spacing increases the productivity of the well, but the incremental production gain for each additional hydraulic fracture decreases. The current field practice is to develop 640- to 1,280-acre leases with 4,000- to 10,000-ft horizontal wells with multiple fractures. However, the determination of the optimal number of fractures is a challenge.
Historically, many of the first horizontal wellbores were drilled using the openhole method in the pay zone. This allowed a significant portion of the wellbore to be in contact with the reservoir. In 2004, a coiled-tubing-deployed jetting assembly was successfully used to focus the stimulation treatments in the openhole wellbore. This further demonstrated that openhole horizontal wells can be successful. Another completion method of that period that is still used is the plug-and-perforation technique in cased holes. The disadvantage of using this completion method, however, is that fracturing fluids can come in contact with the formation for an extended period of time.
Near the wellbore, the flow configuration in a transverse fracture intersecting a horizontal well can be of two types. Outside the fracture, the flow from the reservoir into the fracture is linear; inside the fracture, the flow is converging radial. Additionally, turbulence effects, fracture-conductivity impairment, scaling, and unstable wellbore flow regimes can play an important role in creating pressure drops, which affect well performance.
Hydraulic fracturing is highly complex and variable; the simulation of a fracture as a rectangular wedge is a highly simplified assumption. Similarly completed wells do not demonstrate similar production performance, indicating variability in area reservoir heterogeneity, in both the lease-area scale and the more-distant field scale. There is an urgent need to define optimal well architecture so that current field development can be optimized. Therefore, the following challenges must be addressed: whether it is possible to improve horizontal-well performance economically by increasing the number of fractures, what the optimal intersecting angle is, and whether open- or cased-hole completions are better.
The purpose of fracturing horizontal wells is to create a system so that the long-term performance of the horizontal well will be equivalent to that of a fractured well with a large-enough conductivity and fracture length equal to the distance between the two outermost fractures.
Bakken Shale Case Study
Field Description. The field is approximately 10,000 ft deep, and its reservoir has three informal members, including an upper and a lower black, organic-rich shale, separated by an arenaceous-limestone to siltstone rock. Matrix permeability ranges from 0.005 to 0.5 md and porosity from 8 to 12%. The natural-fracture system is poorly developed, except for a few areas. Oil gravity is 42° API with a gas/oil ratio (GOR) of 1,200 scf/bbl.
Numerical Simulator. The numerical simulator used in this study is a commercial 3D, four-phase, nonisothermal, multiwell black-oil/pseudocompositional simulator. The simulator is built with a comprehensive pressure/volume/temperature module for multiphase simulation. The relative permeability module provides the capability for effective multiphase simulation, including correlation and capillary pressure data. The program provides visualization in two dimensions, a cross-sectional fluid front, and 3D sectional views and can handle vertical, horizontal, and multilateral wells with a special screen to enter drilling data.
Model Description. The model included various equally spaced perpendicular stress-dependent fracture scenarios for homogeneous system permeability, for both cased and open holes (see Table 1 and the Appendix tables of the complete paper for the data used). The model included the reservoir section with discrete hydraulically induced fractures placed along the horizontal-well section. Refined grids were implemented to represent each discrete fracture.
Decision scenarios considered 10,000-ft horizontal wells on 1,280‑acre sector models with multiple-fracture scenarios, including 10, 18, 30, 40, 50, and 60 equally spaced perpendicular fractures for a system permeability of k≈0.05 md.
A simple economic model was used to evaluate all simulated cases. Initial capital expenditure (CAPEX) was proportional to the job size (number of fractures and total volume of proppant placed). The model considered a simple cost model to allow the focus to be on the initial well and fracture-job cost. Also, several other sensitivities were developed, such as fracture-spacing analysis performed by using a one-fourth-sector model. An integrated nodal-analysis model also was built to assess the pressure drop along the horizontal wellbore. (For technical and commercial limitations of this model, as well as a discussion of the multifracture-horizontal-well nodal analysis, please see the complete paper.)
Simulation Results
Fracture-Spacing Performance in Horizontal Wells. Fig. 1 shows the expected performance of a horizontal well for the 30-fracture-well case and k=0.05 md. Initial unrestricted production exceeded 10,000 STB/D but declined approximately 95% during the first year; bottomhole fluid pressure reached the minimum value of 500 psi within a few days of production. The sector-model average reservoir pressure declined approximately 50% during the first 3 years and an additional 16% during the next 3 years but stabilized and achieved a pseudosteady state after 10 years.
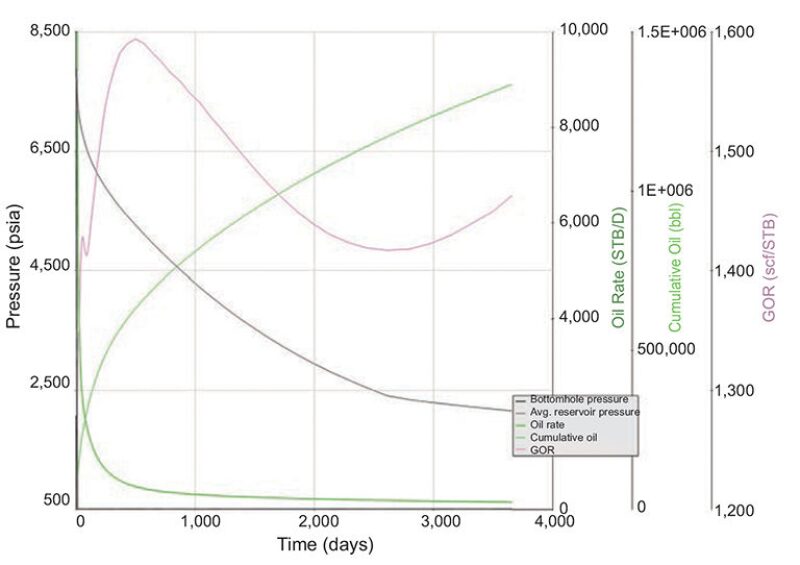
Production GOR was greater than solution GOR initially because the near-wellbore pressure fell below the bubblepoint in the first stages and was maintained well below bubblepoint pressure during the entire life of the well. Free-gas saturation formed in the hydraulically induced and natural-fracture systems near the wellbore.
In regard to multilateral-well performance, oil saturation remained unchanged after 10 years at a distance of approximately 1,200 ft from the wellbore, which would prompt additional infill-drilling opportunities by adding a lateral in the same 1,280-acre pad (1×2 miles).
Sensitivity to gridding and near-wellbore flow-regime and production-performance sensitivities to cased vs. open holes are discussed in the complete paper.
Gross Production Gains From Different Fracture Spacing. The benefit of additional fractures can be observed through the acceleration of production, which resulted in 1.22, 1.32, and 1.37 million STB of oil for the 10, 18, and 40 fractures, respectively, in the 10-year period. The net increase from 10 to 40 fractures was 12% more oil produced. This production increase was directly associated with the larger productivity index (PI) in the enhanced (more fractures) well architecture. Oil PI for the 40-fracture case was almost double throughout the life of the well compared with the 10-fracture case.
The main production gain can be observed in the acceleration of the first and second year of production. The net increase from 10 to 18 fractures in the first 2 years was 162,200 STB, or 17% more oil produced. Similarly, the net increase of 30 vs. 18, 40 vs. 30, and 60 vs. 40 fractures was 160,500 STB (14%), 76,500 STB (6%), and 76,500 STB (6%) more oil produced, respectively.
Economic Indicators. Fig. 2 above shows a comparison of economic indicators considered in this study for the 10-, 18-, 30-, 40-, 50-, and 60-fracture scenarios. Fracture-job cost assumptions rose from USD 2.1 million to 7.3 million, and total well CAPEX assumptions rose from USD 6.6 million to 11.8 million. Development costs increased from USD 5.4/STB to 8.4/STB. The economic optimum depends not only on the oil price, but also on the financial strategy.
Comparing 18- With 10-Fracture Case. The first-year cash flow increased from USD 13.8 million to 16.6 million, and the change in net present value (NPV) increased by USD 3.3 million, whereas return on capital employed (ROCE) was slightly reduced from 618 to 605%.
Comparing 30- With 18-Fracture Case. The first-year cash flow increased from USD 16.6 million to 19.7 million (2.1 million), and change in NPV increased from USD 3.3 million to 4.1 million, whereas ROCE was reduced slightly from 5.0 to 4.4%.
Fig. 3 shows incremental first-year cash flow vs. incremental CAPEX (all with respect to the 10-fracture case). There was a USD 3.4-million, 2.5-million, and 1.1-million incremental gain for every additional dollar spent in completion jobs for the 18- vs. 10-, 30- vs. 18-, and 40- vs. 30-fracture cases, respectively.
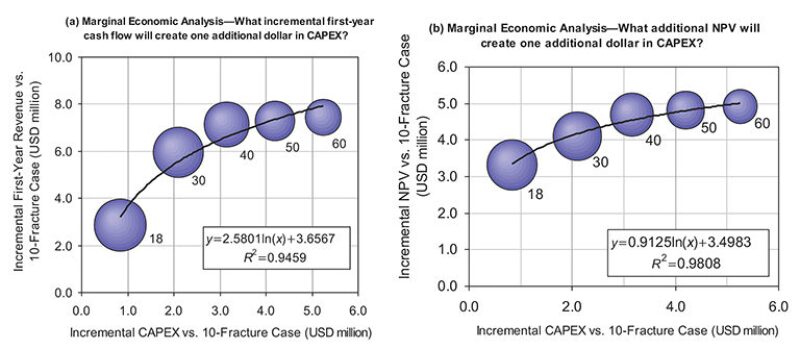
Fig. 3b shows incremental NPV vs. incremental CAPEX (all with respect to the 10-fracture case). Similar to Fig. 3a, there was a USD 3.95-million, 0.62-million, and 0.55-million incremental gain for every additional dollar spent in completion jobs for the 18- vs. 10-, 30- vs. 18-, and 40- vs. 30-fracture cases, respectively.
Sensitivities to System Permeability and Oil Price. Uncertainty scenarios considered variations in permeability (0.001, 0.005, 0.01, and 0.05 md), fracture-conductivity-degradation parameters (200, 350, and 500 md-ft), and fracture length (100, 300, and 500 ft). Oil recovery vs. number of fractures showed better relative improvement for the lower-permeability cases (i.e., for lower permeability, the potential increases of improvement from more fractures).
For any given system permeability and a net oil price of USD 65/bbl, NPV will exhibit a concave-downward shape and a unique global maxima. NPV calculation uses the same economic model as described earlier, but the production cumulative comes from a one-fourth-sector model that can have some variations compared with the full-sector model.
For a given system permeability and net oil price of USD 45, 55, and 65/bbl, there is an optimal number of fractures to be placed in the 10,000‑ft horizontal well (e.g., 20 is the optimal number for a system permeability of 0.01 md if net oil price is USD 45/bbl; 46 fractures is optimal for USD 55/bbl; and 70 fractures is optimal for USD 65/bbl).
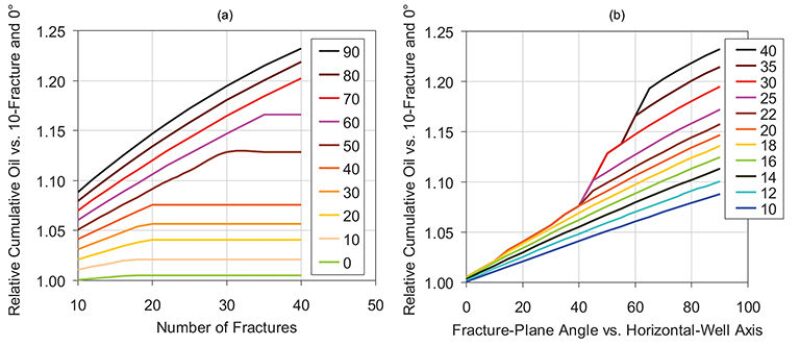
Horizontal-Well Orientation With Respect to Fracture-Growth Direction. Fig. 4 show the relative 10-year cumulative oil production vs. the number of fractures (Fig. 4a) and vs. fracture angle (Fig. 4b). The base case was the 10-fracture and longitudinal fracture case (angle=0), with k=0.05 md and with the 10,000-ft horizontal well. Reserves recovery was greater for greater angles (perpendicular fractures) and a higher number of fractures. The number of fractures contributed to less than 5% additional oil for fracture planes less than 20°. Fracture planes greater than 50° can enhance reserves recovery from 15 to 23%.
Sensitivity to Horizontal-Well-Model Coverage: Full- vs. One-Fourth-Sector Model. The base case for this comparison was the perpendicular-fracture case (angle=0), with k=0.05 md and with the 10,000-ft horizontal well. Errors greater than 5% occurred during the first 2 to 5 years of production. The greater the number of fractures (more than 30 fractures per well), the greater the error expected between the full- and one-fourth-sector model. For later stages (beyond 7 years), errors tended to minimize to approximately 3% for the higher number of fractures (50 to 60). For the 10-fracture case, error minimization occurred at a very late stage beyond the 10-year horizon shown.
This article, written by JPT Technology Editor Chris Carpenter, contains highlights of paper SPE 167770, “Design Optimization of Horizontal Wells With Multiple Hydraulic Fractures in the Bakken Shale,” by Luigi Saputelli, SPE, Frontender Corporation; Carlos Lopez, SPE, BP; Alejandro Chacon, SPE, Halliburton; and Mohammed Soliman, SPE, Texas Tech University, prepared for the 2014 SPE/EAGE European Unconventional Resources Conference and Exhibition, Vienna, Austria, 25–27 February. The paper has not been peer reviewed.