
Queensland, Australia, is currently host to a number of coal-seam-gas (CSG) to liquefied-natural-gas (LNG) projects under development. However, the need to build field deliverability before the availability of export gas markets presents a significant challenge. CSG wells must be dewatered; during this process, gas production may need to be constrained. The ability to manage and forecast production performance in a field-turndown scenario is therefore critical. A study of production data from CSG-production-interruption events was conducted to determine how wells reacted to turndown of gas-production rates.
Introduction
There are currently three major CSG-to-LNG projects under construction in Queensland. A number of other projects are also proposed and are currently in various stages of planning and approval.
The transition from a domestic gas market to an export LNG market presents many opportunities and challenges for gas producers. When the LNG-export facilities are commissioned, the gas demand markedly increases over a short period of time. To ensure the best return on capital investment and to satisfy export contracts, the use of these export facilities needs to be maximized as soon as possible after commissioning. To optimize field output at the time that downstream facilities become operational, the CSG reservoirs must be dewatered in advance, resulting in an increase of produced-gas volumes along with the early water production. One challenge for upstream producers is how to manage field deliverability during a period (the ramp period) when there is little ability for existing markets to absorb significant increases in gas supply. Possible solutions include gas storage, flaring, and the constraining of gas production while continuing to dewater the reservoir (turndown), or some combination of these and other strategies. The optimum strategy is likely to be a function not only of reservoir performance but also of the various commercial, operational, and project-execution constraints faced by each operator.
Review of Historical Production Data
Historically, field turndown in the areas of study has been achieved through the selective choking or shut-in of individual producing wells. The primary factors in well selection have been gas and water production, completion status, and liquid-lift calculations.
Production data from existing CSG fields were analyzed to investigate the impact of well-turndown events and make recommendations for future operations. A total of 46 well-turndown events were cataloged. The events included both partial choking and complete shut-in of producers; wells studied included completions both with and without artificial lift installed, though naturally flowing wells represented the majority of events. Where wells were shut in, the duration of the event varied between 2 and 36 days, with an average of 10 days. The average time for choking back a well was greater than 80 days, with some wells being choked back for more than a year because of gathering-system constraints. Despite the small sample size, the data set was considered representative of operational experience and appropriate to guide assumptions for application to a field-production model.
Traditionally, the risk of liquid loading is determined by critical lift calculations as part of an integrated production-modeling study. Such a method seeks to model the wellbore hydraulics and requires knowledge of well configuration and reservoir conditions and operating pressures, which may not be known with reasonable certainty. To simplify the analysis, the approach taken in this study has been to rely on observed production data rather than integrated production modeling to generate rate-based criteria for liquid-loading risks and then to use these criteria to select wells for turndown operations.
Analysis of the historical data demonstrated that wells that had been turned down (either choked back or shut in) were observed to resume production with 6% higher gas rate and 16% higher water rate after the turndown, compared with before the turndown. When comparing turndown method, shut-in wells (11% higher gas rate on return) performed slightly better than choked wells, which resumed their previous gas rate.
Although the average rates show a small increase, in approximately 25% of cases there is a temporary decrease in gas rate following shut-in or choke back. In these cases, analysis of the individual-well trends shows no evidence of permanent flow reduction caused by turndown. The data therefore appear to validate earlier operational practice in minimizing long-term production risk.
While free-flow wells were observed to rebound quickly to preturndown rates, pumping wells took substantially longer. Further analysis of well performance after turndown, conducted on the basis of original gas and water rates, resulted in a set of guidelines (described in the complete paper) for selection of candidate wells for turndown operations.
Where cycling of wells cannot be achieved, or where field-turndown requirements cannot be executed without material reduction in overall dewatering rates, numerical modeling of field performance is recommended to validate field-management strategies.
Modeling Approach
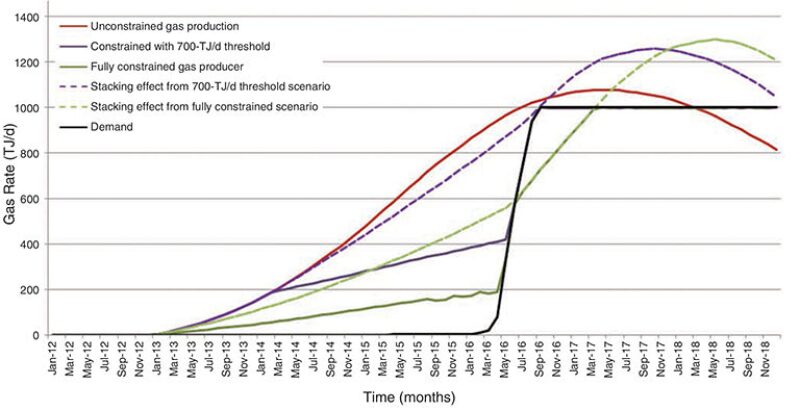
A hypothetical field-development plan is presented in the complete paper to demonstrate the impact of turndown strategy and well recovery on overall field production. A hypothetical demand of approximately 1000 TJ/d from March 2016 has been assumed to represent a sharp rise in demand from LNG facilities being commissioned. To meet this demand, a field of 1,260 wells is developed on the basis of a ramp well schedule of 30 wells per month. All wells are assumed to have the same forecast performance, with a peak gas rate of approximately 1,180 Mcf/D and a peak water rate of approximately 300 B/D. This is a purely hypothetical development and does not represent an actual project that is under way or planned.
The hypothetical field-development plan used in this paper is shown in Fig. 1 above. The coloring in this figure represents the tranche of gas from wells with the same online date. In an unconventional play, the rate at which wells are brought on line impacts the overall field production. It should be noted that the shape of the overall field profile differs from the shape of the forecast of individual wells. It is important to consider the effect of constraining production on the overall field profile.
A model that assesses the effect of constraining production of individual wells on the overall portfolio is described in the complete paper. This model aims to capture the main variables involved in constraining wells, to allow multiple scenarios and sensitivities to be assessed. For a summary of these variables, please see Table 1 and Fig. 2 of the complete paper.
Regional Impacts. Consideration also must be given to the regional impacts of shut-in wells, as opposed to the impact of shut-in on an individual well. This modeling does not attempt to capture regional effects; this should be an area of ongoing monitoring and study. To minimize the effect on a region, the total number of wells that can be shut in at any one time is limited in the modeling. As a rule of thumb, no more than one-third of the wells in an area are shut in. However, because this is an issue of uncertainty, sensitivity analysis is recommended to determine the impact on the results.
Choking vs. Shut-In. The shut-in of wells, as opposed to choking, has been chosen as the turndown method for this study. This is based on both theoretical well behavior and the analysis of available empirical data. The study of historical production data showed that there are more recorded occurrences of wells having been shut in than having been choked, which increases the confidence in predicting future behavior because of the larger sample size. The shut-in of wells is also supported by theoretical well behavior, because it allows the pressure in the well and coal seams to build throughout the shut-in period, which should facilitate flow when the well is opened. Conversely, choking wells may inhibit the ability of the gas to lift water.
Recovery and Refractory Periods. There is variability in the recovery time after a shut-in event. The analysis of historical production data shows that, while free-flow wells recover very quickly, it generally takes a period of three times the shut-in period for most pumping wells to recover their preturndown rates. Linear recovery of rate is assumed in this modeling and is considered appropriate, because this recovery has generally been observed to occur over short periods of time. Related to the rate-recovery period is the refractory period, which is the period of time a well must be left on full production before being eligible to be shut in again. Usually, the refractory period should be at least as long as the rate-recovery period, because it is advisable to observe that the well has recovered completely before entering another shut-in period.
Shut-In Duration. To ensure continued dewatering of an area, it is suggested that a proportion of wells be left on full production at any one point in time. This will help avoid gas-production capacity being reduced because of insufficient dewatering of an area. To ensure even dewatering, wells can be cycled through periods of full production and shut-in. If one-third of the wells are required to be left at full production for adequate dewatering of an area, then the wells could be shut in for a period of 2 months, with a 1-month refractory period. This cycling of wells also allows monitoring of the response to shut-in. A longer refractory period may be required if a well has not recovered to its preproduction rate by the time it is due to be shut in again. The shut-in and recovery periods can be tuned over time, with potentially larger shut-in periods for wells that recover quickly. Longer cycle times will also reduce the operational overhead required to manage the turndown strategy.
Turndown-Modeling Observations
Gas- and Water-Rate Thresholds and Dewatering Period. Shutting in wells that have not had sufficient dewatering results in a reduction in excess gas during the ramp period, but at the expense of a delayed peak production. Consideration of the turndown strategy is an important part of field-development planning because the selection and quantity of wells to constrain (and the timing) can effect the field’s production profile greatly. The conclusion of the data review was that wells with high gas rates (greater than 1,000 Mcf/D) and low water rates (less than 1,000 B/D) are more-successful shut-in candidates. The shut-in criteria for individual wells must be balanced with the optimal dewatering period to ensure that peak production is not delayed.
Instantaneous Capacity and Impact on the Long-Term Profile. Shutting in wells changes the shape of the well-production profile. If the shut-in operations occur before the peak, as is usually the case when managing field ramp up, then the peak is delayed.
This effectively changes the well schedule defined during the field-development-planning process and alters the overall production profile. If insufficient dewatering has occurred, the peak may appear significantly later. Because of the delayed peaks and a stacking effect, the peak production may be higher as a result of the turndown strategy, as shown in Fig. 2. This artifact helps mitigate the risk of production dampening post-turndown (i.e., wells not returning to their preturndown rates). This stacking effect also applies to the water profile, which may cause a water constraint to be breached, resulting in reduced production. The likelihood of this happening is reduced by allowing an adequate dewatering period and only allowing wells to be shut in if the water rates are lower than a specified threshold.
This article, written by JPT Technology Editor Chris Carpenter, contains highlights of paper SPE 167088, “Coal-Seam-Gas-Field Management: Well-Performance and Production Forecasting During Shutdown and Recovery Operations,” by S. Magee, T. Ogilvie, and C. White, Origin Energy, prepared for the 2013 SPE Unconventional Resources Conference and Exhibition—Asia Pacific, Brisbane, Australia, 11–13 November. The paper has not been peer reviewed.