
Applying a cutoff consists of defining a threshold value on one or more logs to separate the reservoir intervals in which hydrocarbons are mobile from the gross rock thickness. In a thin-bed context, this deterministic approach is insufficient because of the resolution of the logs and a limited number of data. The probabilistic approach proposed in this paper considers that the relationship between the cutoff value on the selected log and hydrocarbon mobility in the sandy laminae is a statistical function.
Introduction
Cutoffs in petrophysics are frequently applied in the oil and gas industry. Previous work has shown the benefits that result from their use, in particular the decrease in the biases related to the upscaling of petrophysical properties, as well as the usual disadvantages of using cutoffs (i.e., the possible decrease of volume-in-place calculations and connectivity). The overall increase in computer power and cell-size reduction in cellular models, as well as the improvement in upscaling methodologies, render the use of cutoffs less crucial for massive sandstone facies.
The objective of this paper is to propose a probabilistic approach to cutoffs in order to improve the coherency and quality of 3D cellular models.
Thin Beds and Cutoffs
Thin beds are a common occurrence in turbiditic, deltaic, and tidal series. They consist of alternating sand and clay layers that have a thickness of less than 50 cm. Outside these layer thickness, sand and clay are well-distinguished on classic logs and are not considered to be thin beds. Thin-bed facies are heterogeneous, and sampling by wells is insufficient to obtain a representative set of calibration and data; thin beds are undersampled.
At the scale of the core, the variability of sand proportion and of lamina thickness in thin beds is clearly observed. The usual work flow to carry information from core to log and then to grid-cell size includes two scale jumps. The synthesis of sedimentological core characterization and image logs into a high-resolution petrophysical log is used to calibrate the quantitative interpretation of wireline/logging-while-drilling logs. Petrophysical data that result from this interpretation then need to be upscaled per facies (or rock type) to the cell size of the 3D reservoir model.
Applying a cutoff consists of defining a threshold value on permeability or other logs that will define reservoir intervals in which hydrocarbons are mobile. Byproducts of a cutoff include net height and net-to-gross (NTG) ratio, the ratio of net height to total height.
The examples in this paper are all extracted from turbidite environments with a shallow burial where cutoffs on the log of volume of clay (VCL) are the best indicator. Cutoffs are applied at log scale on one or more petrophysical parameters in order to take a phenomenon into account: fluid mobility at the scale of the lamination. The relationship between VCL and fluid mobility is statistical. The cutoff is then consolidated at the scale of one or more fields, taking into account fluid types and production mechanism; this operation also relies on statistics.
Well sampling in the laminated facies is often insufficient to capture heterogeneity at these different scales. Net height, computed through cutoffs, is very sensitive to small variations in parameters such as cutoff value and VCL-log and lithology variations at small scale. This explains the limitations of a deterministic cutoff in thin beds. When considering a cellular model and the way the log information is upscaled to the cell size, the limitations of a deterministic cutoff are even greater.
Probabilistic Approach to Cutoffs
The deterministic cutoff is based on the definition of one VCL value that will allow separating net intervals from nonnet intervals. Below this VCL value, the probability that a sand lamina belongs to the net is 100%. Above this VCL value, the probability for a sand lamina to be in the net is 0%. This evolution is represented by the dotted curve in the diagram in Fig. 1. In the probabilistic approach to cutoffs, two outstanding points are defined, named P1 and P0 (Fig. 1a). For all values of VCL lower than np1 (VCL value at the point P1), the probability for a sand lamina to be counted in the net is 100%. For all values of VCL greater than np0 (VCL value at the point P0), the probability for a sand lamina to be counted in the net is 0% (Figs. 1a and 1c).
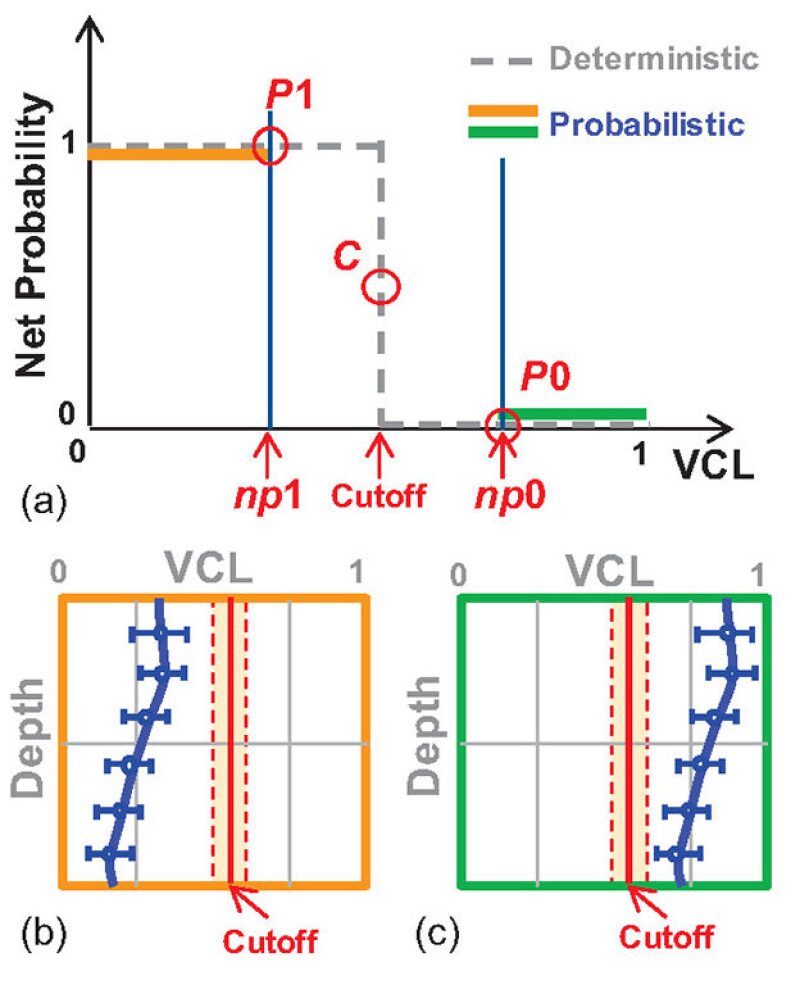
The cutoff value is another outstanding point (named C). Because this value was chosen as the best threshold to separate net from nonnet, the probability of a sand lamina being counted in the net is 50%. Between these outstanding points, the probability of a sand lamina being counted in the net is a function of 1–VCL.
The probability of the net is systematically overestimated when VCL is smaller than the cutoff value and underestimated when VCL is higher than the cutoff value. This observation is important because the biases described affect the porous volume. When a deterministic cutoff is applied, the porous volume in “sand-rich” thin beds is overestimated, and that in “clay-rich” thin beds is underestimated.
The function that links the probability of a sand lamina being counted in the net with VCL results, in fact, from the combination of various parameters, mostly independent of each other, that can vary at small scale.
The probabilistic approach to cutoffs is adapted to sensitivity studies, and it is quite simple to compare different cutoff choices and to estimate, for the various thin-bed facies, the stakes associated with porous volume.
Minimodels and the Upscaling Process
Upscaling of petrophysical properties is conducted for each facies by use of two regular minimodels (made of regular cells). The first minimodel consists of a grid, the cell size of which is compatible with log resolution. The second minimodel consists of a coarser grid, the cell size of which corresponds to cell size in the 3D reservoir grid.
Petrophysical properties VCL and effective porosity (PHIE) are simulated geostatistically in the fine grid by use of the results of a univariate and multivariate statistical analysis performed on well-log data. Cutoff rules are then applied to each cell. This operation results in the generation of two new parameters: NTG indicator (binary, either 0 or 1) and PHIEnet (PHIE remaining in the net). Properties are then upscaled in the coarse grid. To obtain a good statistical representation of the upscaled parameters, the procedure is repeated through a multirealization process.
Typical statistics are run in the coarse minimodel to determine mean values, distribution laws, and correlation coefficients between parameters. These are ultimately used as input statistics for the 3D reservoir model. The probabilistic approach to cutoffs is taken into account in every cell during the cutoff operation on the fine grid.
The following example illustrates the way the rules are applied. VCL and PHIE properties have been simulated in the fine grid of the minimodel. Let us now consider a given VCL value A below the deterministic cutoff value that corresponds to a probability for a sand lamina to be counted as net of 80%. If the deterministic cutoff is applied, then all cells with VCL=A have an NTG indicator equal to unity. If the probabilistic cutoff is used, then 80% of those cells with VCL=A will have an NTG indicator equal to unity, and the remaining 20% of the cells an NTG indicator equal to zero.
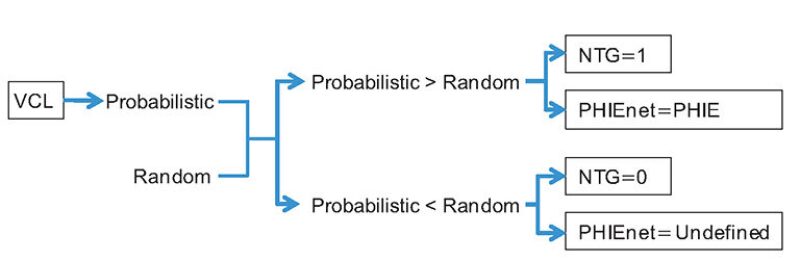
The rule for applying the probabilistic cutoff is, hence, quite simple (Fig. 2). For each cell, a probability deduced from the modeled VCL value is compared with a random sampling in the (0, 1) interval. If the random value is less than the probability value, then NTG=1 and PHIEnet=PHIE. If the random value is greater than the probability value, then NTG=0 and PHIEnet is a nonvalue (undefined).
Results of Minimodel Upscaling and Comparison of Probabilistic-Cutoff and Deterministic-Cutoff Approaches
Results obtained with the application of a deterministic cutoff are very different from those obtained through the probabilistic approach to cutoffs. The main difference is found in the mean value and the distribution of the NTG in the main thin-bed facies. The deterministic cutoff overestimates NTG in the sand-rich facies and underestimates NTG in the sand-poor facies. This result is illustrated by the example illustrated in Fig. 3, built using synthetic data.
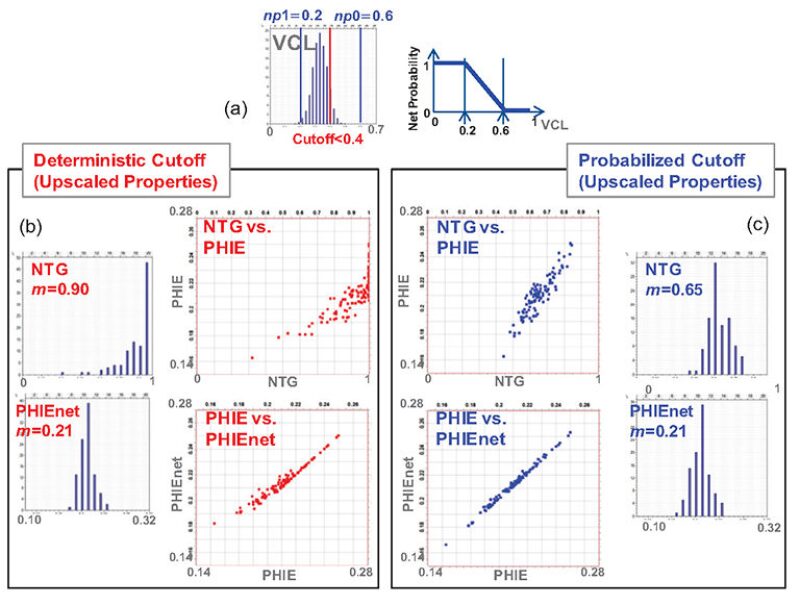
In this example, the facies simulated in the minimodel is sand-rich. The VCL distribution is given in Fig. 3a. The cutoff on the VCL is set to 40%. The probability of a sand lamina being counted in the net is 100% when VCL is less than 20%, and is 0% when VCL is greater than 60%. Probability evolves linearly between the two points. The application of a deterministic cutoff results in obtaining an average NTG for the whole minimodel equal to 90%. After upscaling, the NTG distribution is highly asymmetrical, with a majority of values close to unity (Fig. 3b). The average value of net porosity is 21%, and the distribution of PHIEnet is slightly asymmetrical. The scatter of the points on an NTG-vs.-PHIE crossplot reflects the strong asymmetry of the NTG distribution. A correlation coefficient calculated from such a crossplot cannot be used in a modeling process based on cosimulation between NTG and PHIE. The scatter of the points on a PHIEnet-vs.-PHIE crossplot reflects the slight asymmetry of the PHIEnet distribution.
The application of a cutoff with the probabilistic approach results in obtaining an average NTG for the whole minimodel equal to 65%, very different from the previous result. After upscaling, the NTG distribution is slightly asymmetrical (Fig. 3c). The scatter of the points on an NTG-vs.-PHIE crossplot reflects a good correlation coefficient, easily usable in a cosimulation modeling process. The same observations apply for the PHIEnet-vs.-PHIE crossplot.
This example corresponds to sand-rich thin-bed facies. It shows that when a deterministic cutoff is applied, both NTG and pore volume are overestimated compared with a probabilistic evaluation. A similar comparison on a sand-poor thin-bed facies demonstrates that the deterministic cutoff underestimates both NTG and pore volume compared with a probabilistic evaluation.
For a comparison of deterministic and probabilistic approaches in a real case study, please see the complete paper.
Sensitivities to the Endpoints of the Probability Function
The probability function of the net is defined between two VCL endpoints, np1 and np0, corresponding to the outstanding points defined earlier. When the two endpoints equal the cutoff value, then the cutoff is deterministic. Sensitivities on the impact of the probability function of the net on NTG are conducted by progressively separating the endpoints from the cutoff value.
Fig. 4 illustrates this sensitivity analysis in a sand-rich thin-bed facies. The separation between the endpoints np1 and np0 is gradually increased by 0.1 until it reaches 0.4. At each 0.1 increment, the NTG is visualized in the fine grid, in the coarse grid, and in the form of a histogram of the upscaled property; the mean NTG value is given along with the difference between the mean NTG and the deterministic NTG. Fig. 4 reflects the rapid variation of the mean value of NTG and the evolution of the shape of the distribution as the separation between the endpoints increases.
This article, written by JPT Technology Editor Chris Carpenter, contains highlights of paper SPE 166045, “Thin Beds and Cutoffs: A Probabilistic Approach for an Improved Assessment and Modeling of the Net Porous Volume,” by J. Clavel and P. Ruelland, Total, prepared for the 2013 SPE Reservoir Characterisation and Simulation Conference and Exhibition, Abu Dhabi, 16–18 September. The paper has not been peer reviewed.