In the early 1980s, while the authors of the original paper were reassessing some old gravel-pack sands from a well, some sludge was noticed in the samples. The sludge had plugged formation and the gravel-pack pores. The permeability was so low that the owner of the oil property considered abandoning the well and consequently stopped all workover measures, concluding that there was no more oil left in the reservoir. The scenario suggested the existence of bacteria in the oil. In the current study, a novel, sensitive technique for bacterial deoxyribonucleic acid (DNA) fingerprinting is implemented.
Introduction
To find bacterially induced chemical changes in oil, the research team in the first of two complete papers (only the second part is summarized here) compared the chromatograms of six carefully sampled oils obtained from two wells. The oil samples were taken directly from two wellheads without disrupting the production from the naturally flowing wells. To obtain a representative oil sample from each perforation interval, three samples were taken at different time intervals approximately half an hour apart. The distance between tops of producing intervals was approximately 3,000 ft, and the wells were designated Well A and Well B. The operator believed the two wells produced oil from the same reservoir. Despite their effective use as a tool in oil fingerprinting, chromatographic fingerprints of oil samples raised more questions than the team expected. Actually, in view of the well-known fact that oil reservoirs provide a favorable ecosystem for the growth of bacteria colonies, the precise role of bacteria in modifying the oil chemical compounds or creating new compounds could not be ascertained by use of the chromatograms.
The bacterial growth indigenous to the reservoir is attributable to the abundance of nutrient, whether inorganic, organic, or a combination of both. To survive, the bacteria must adapt to conditions in which they find themselves. The process of adaptability of bacteria to their surroundings (i.e., reservoir-rock minerals and reservoir fluids as nutrients under reservoir conditions) can and will change rock petrophysical properties such as zeta potential; rock wettability; relative permeability; and permeability to water, oil, gas, or other flowing fluids. Generally, the bacteria in the water phase of petroleum reservoirs possess the ability to modify the surface chemistry of rock minerals and to extract or to concentrate metal and nonmetal ions.
Molecular-biology techniques have only recently been used for exploring for oil reservoirs. Recent achievements in molecular biology have extended the understanding of the role of microbial transformation and maturation of petroleum compounds under certain pressure and temperature windows and have enhanced our ability to investigate the microbial communities in petroleum-impacted ecosystems. The analyses mostly have focused on identifying the diversity of microbial species present in or on the seeps, seabed, gas vents, and reservoir waters by use of microbial 16S rRNA, a ribosome (a ribonucleic acid found in all microorganisms since the beginning of life on the planet). To identify a microorganism, its 16S-rRNA sequence information is checked against the 16S‑rRNA sequence data available in the GenBank database. 16S-rRNA gene information is available for microorganisms found in different parts of the world and great distances apart such as North Sea, South American, and Asian oil fields. By use of these free gene databases, microorganisms most closely related to those which have been found in oil or gas reservoirs can be identified accurately.
Other than exploration for oil and gas, there are other engineering applications for classifying the bacteria type and determining bacteria impact on oilfield production systems. Because of the high demand for oil, it is crucial to investigate whether there are any micro-organisms in the crude oil, determine their source of life, their original environment, and their effect on the crude-oil and reservoir-rock properties. For example, industrial research shows most bacteria, either aerobic or anaerobic, have two states: planktonic and sessile. In the first state, bacteria freely float and swim. In the second state, they attach to any surface (i.e., reservoir rock, reservoir caprock filled with bacterially produced cements, and unconventional shale reservoirs filled with organic matter). In formation-damage-control research, as mentioned previously, we were concerned about the second state simply because bacteria, being a sessile microorganism, can modify the rock-grain surface (thus affecting rock wettability and relative permeability to oil and water), and can cause plugging of the flow path of any permeable system, including porous media.
For this study, we implemented a novel, accurate, and sensitive technique for bacterial DNA fingerprinting involving denaturing-gradient-gel electrophoresis of polymerase-chain-reaction-amplified 16S rRNA. This approach has permitted us to identify and classify bacteria found in oil samples specific to the wells under consideration.
Research Methodology and Discussion of Results
In the first of two complete papers, the authors proved the existence of living bacteria in the fluid, implemented an advanced technique for bacterial-DNA fingerprinting of oil samples in Wells A and B, and compared the results with gas-chromatography results. In this, the second part of the research, the authors follow the DNA isolated from oil samples. (For the geography of the field and the biostratigraphy of the reservoir for DNA research, please see the complete paper.)
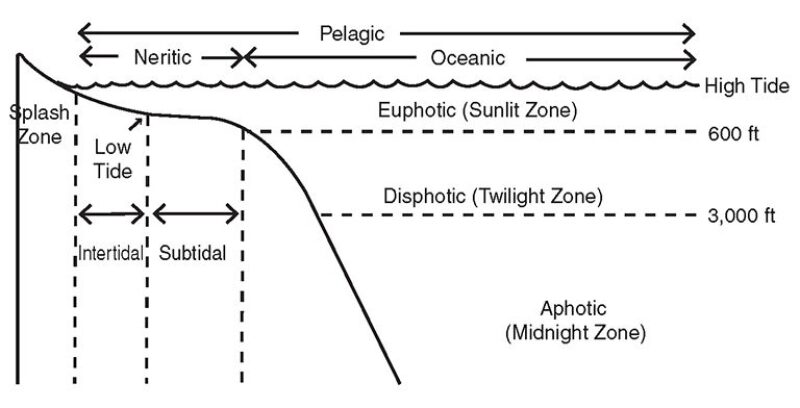
Depositional Environment of Wells A and B for DNA Research. Fig. 1 shows a schematic of paleobathymetry of the Gulf of Mexico (GOM) coast associated with a Cibicides carstensi zone that is the focus of the research. The biomarker is found mostly in neritic-to-shallow middle bathyal. The water depth in these zones ranges approximately from 60 to 300 ft. In some cases, C. carstensi microfossils are found in brackish-to-marine waters, indicating changes in the environment of Middle Miocene deposition centers.
Biostratigraphy of the C. carstensi Reservoir for DNA Analysis in Wells A and B. The reservoir appears between Upper and Middle Miocene sands along with other biomarkers and their extinction zones. The sand in Wells A and B was first drilled in the early 1980s.
Stratigraphy and Structure Map of the Reservoir of Wells A and B Where Oil DNA Was Discovered. Fig. 2 shows the general area of the field. The major features in this area are first-order growth faults as shown next to small dark arrows. The next important features that could have potential effect on the DNA found in reservoir fluids are the second- and third-order small growth faults. The potential effect of smaller features will be discussed later when addressing the differences discovered in DNA from Well A and B fluid samples. In short, the first-order growth fault dominates the region in Fig. 2a, and the second- or third-order smaller growth faults are encountered near the main faults. Depth of this Miocene siliclastic sand sediment in some cases could reach as great as 10,000 ft in the northern part of the GOM. The highlighted square part of the map shows the area where Wells A and B are located. Most of these reservoirs produce fluids under moderate-to-strong waterdrive mechanisms.
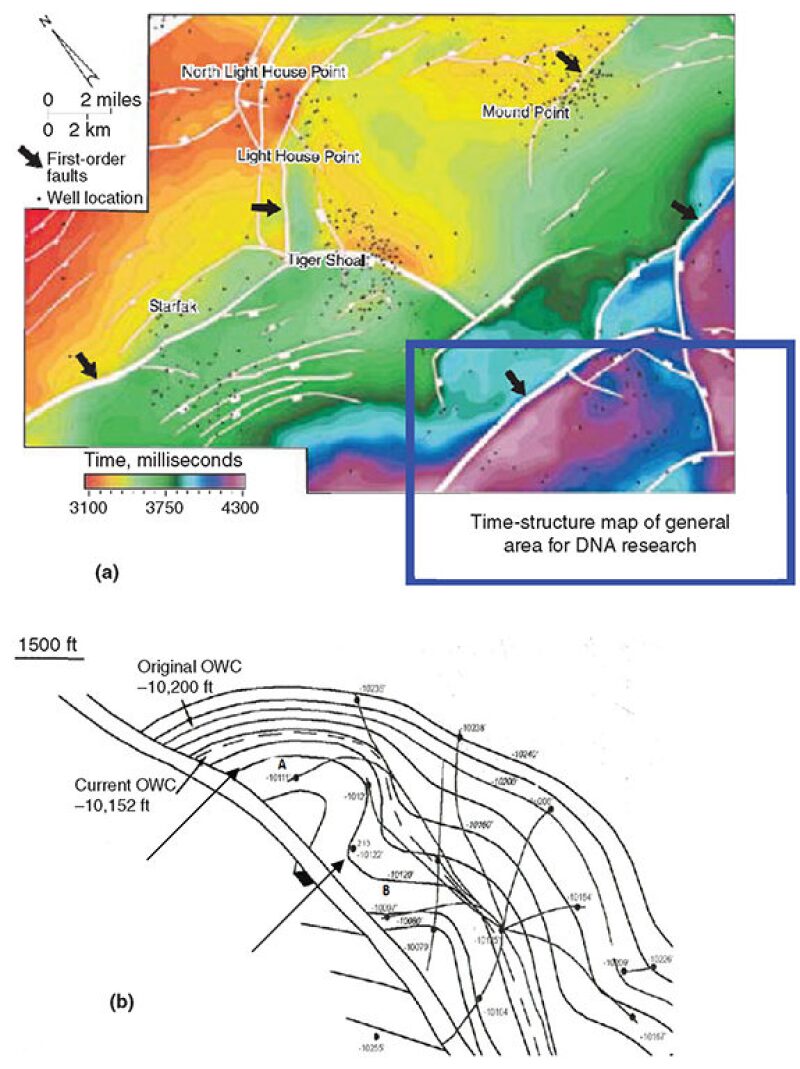
Fig. 2b exhibits the structure map of the field where Wells A and B are located. The most likely strategy for drilling these wells is based on drilling and developing Wells A and B near the first-order growth faults first, and then extending developments by sidetracking the wells. It appears the smaller traps of second- and third-order growth faults may have been ignored.
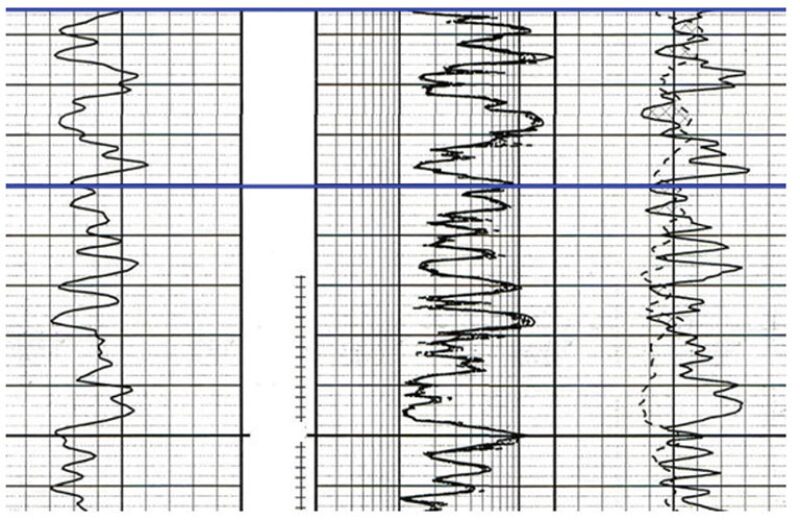
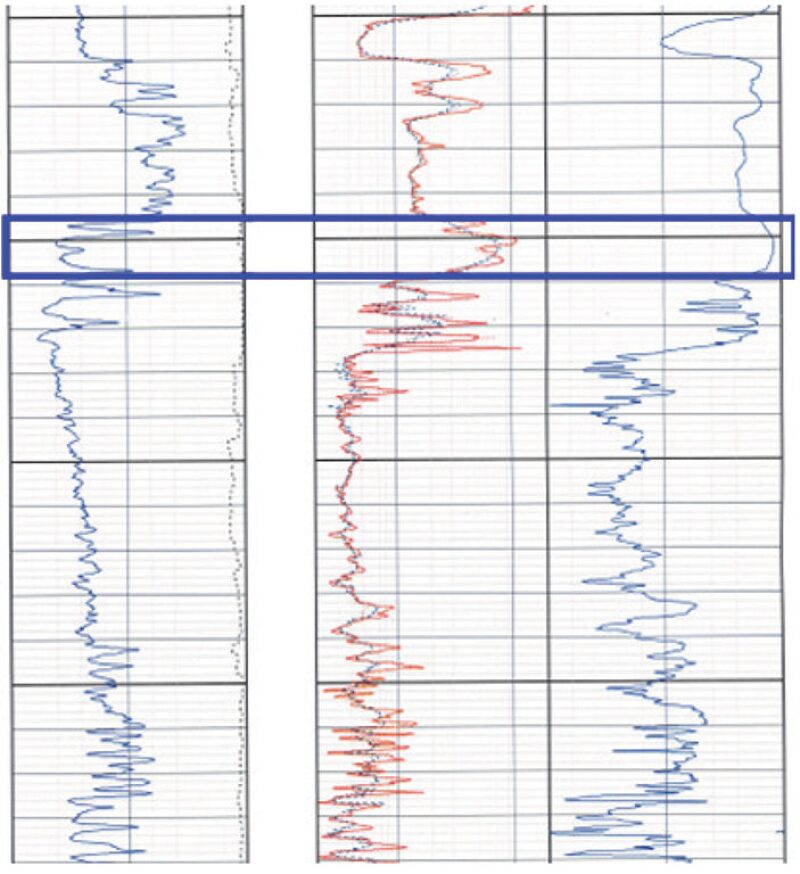
Well Logs From Wells A and B Where Perforated Intervals Yielded DNA. Fig. 3 shows a log of Well B, which includes traces of gamma ray, resistivity, and porosity in the respective order from left to right (Tracks 1, 2, and 3). This log shows shale and sand sequences typical of some oil fields in the GOM. The producing interval in this well exhibits moderate-to-high porosity and permeability. Fluid Samples B1, B2, and B3 were produced from the upper interval shown in Fig. 3 (above the dark horizontal line). The same is true for Fig. 4, which shows a log of Well A. Again, the bracketed area in Fig. 4 shows the formation from which Fluid Samples A1, A2, and A3 were produced for DNA analysis.
To the best of the authors’ knowledge, this is the first time in the mapped area (Fig. 1 in the complete paper) that DNA and chromatograms from two different wells presumably drilled in the same reservoir have been analyzed and compared and is the first use of DNA analysis for determining if Wells A and B do produce fluids from the same reservoir.
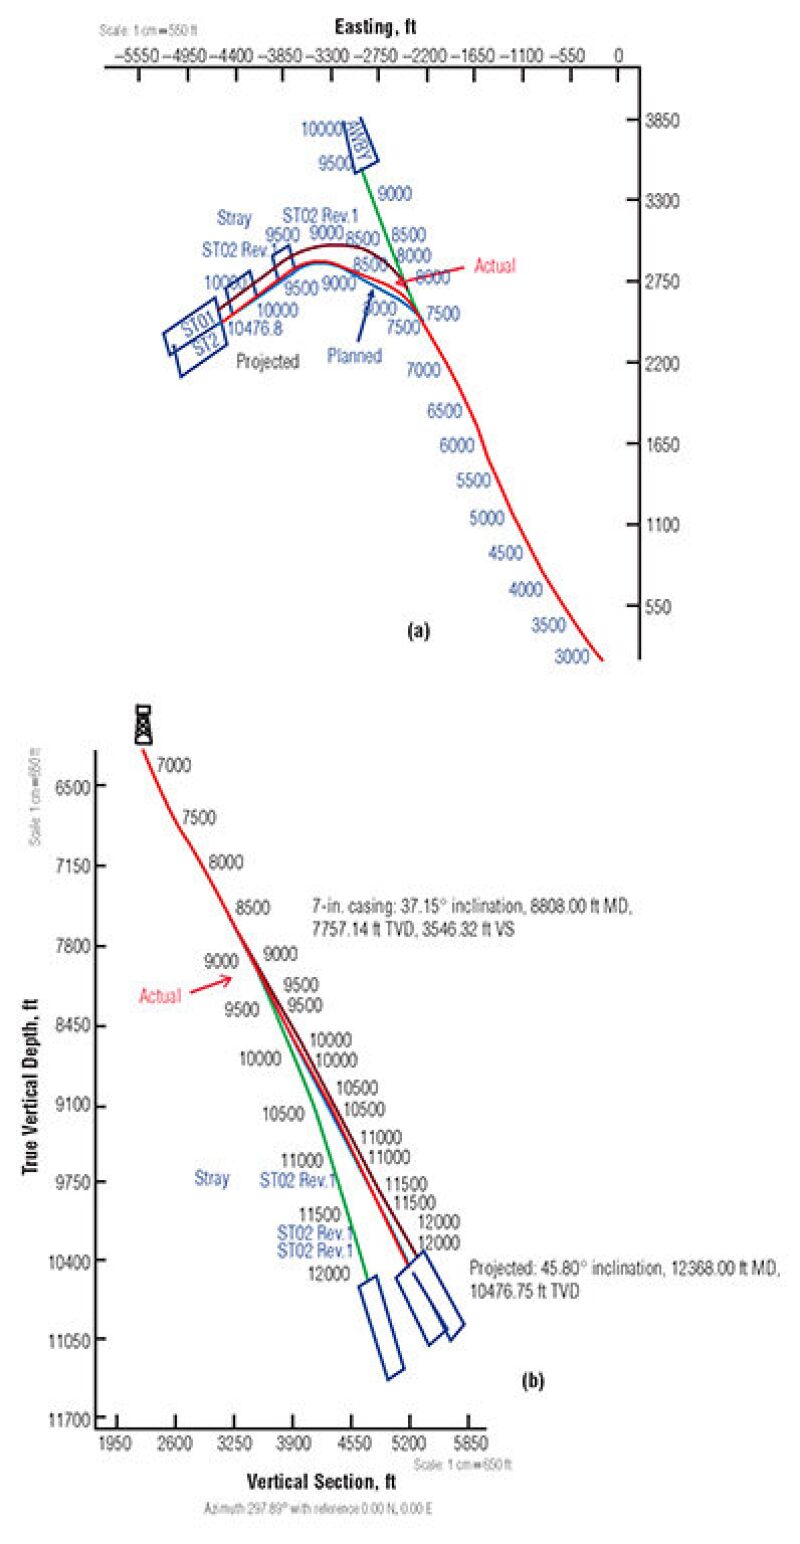
Drilling Trajectories for Wells A and B. Fig. 5 (plan view) and Fig. 5b (true vertical trajectory) show planned drilling and actual trajectories of the Well A sidetrack. The actual trajectories often are determined by conducting gyro surveys. Only the drilling plots of Well A are shown. These plots suggest that the well path in this heavily faulted area may have crossed some second- and third-order faults before reaching the trap section of the first-order (major) fault, as shown in Fig. 2b. As such, the drilling data as well as seismic data may warrant another careful analysis to make sure some reserves have not been bypassed. The same study approach may be extended to the area of Well B. In short, because drilling plans were developed for exploring the target sand near the major faults, the well-log and drilling data seem to suggest that Well A and B trajectories may have missed the traps of second- and third-order faults and that Wells A and B are not producing from the same reservoir. (For well completion and perforation intervals for Wells A and B where DNA of oil was extracted, please see the complete paper.)
DNA Analysis of Samples Produced From Wells A and B and Reservoir Characterizations
16S rRNA in the microbial isolates was used to analyze bacterial diversity. This specific nucleic acid was selected because (a) this gene is present in all bacteria; (b) the function of the 16S-rRNA gene has not changed over the time since life began on Earth, suggesting that random sequence changes are an accurate measure of time (evolution); and (c) the 16S‑rRNA gene base pair, 1500 bp, is large enough for informatics purposes.
Interestingly, data support our suspicion that the fluids produced from these two wells are from two totally different origins. On one hand, the bacteria corresponding to DNA bands in fluids produced from Well A are found in a neritic “marine” environment, as shown in the sketch of Fig. 1. On the other hand, the bacteria corresponding to DNA bands in the fluids produced from Well B live in grassland, lacustrine, freshwater environments. These data suggest that the heavy faulting in this area, as shown in Fig. 2, along with subsidence and other processes, may have been responsible for separating the original C. carstensi sand into several totally different reservoirs.
This article, written by JPT Technology Editor Chris Carpenter, contains highlights of paper SPE 166087, “Application of New Fingerprinting of Bacteria DNA in Crude Oil for Reservoir Characterization—Part II,” by A. Hayatdavoudi, N. Chegenizadeh, A. Chistoserdov, F. Boukadi, and R. Bajpai, University of Louisiana at Lafayette, prepared for the 2013 SPE Annual Technical Conference and Exhibition, New Orleans, 30 September–2 October. The paper has not been peer reviewed.