Recent advances in sensor technology and petroleum science allow using downhole-fluid-analysis (DFA) data to improve confidence in reservoir architecture. New independent work flows are especially valuable when used in concert with pressure/volume/temperature (PVT) reports, well-test data, static-pressure gradients and other common techniques used to assess reservoir architecture. This paper presents two real-field case studies from the Norwegian continental shelf that use available DFA data to support the assumptions made from other data on reservoir architecture between wells.
Introduction
A valuable plan to manage subsurface uncertainty assesses the effect of fluid properties on the project execution. Understanding the fluid properties and their vertical and lateral distribution will elucidate quality and continuity of the discovery during the exploration-and-appraisal phase and extend into deciding on development options. The fluid distribution in the reservoir is a function of source-rock material, migration path, charge history, charge mechanisms, processes working toward fluid equilibration and disequilibrium, geologic setting, burial history, reservoir architecture, and timing. Therefore, an interdisciplinary approach is necessary to make use of the information contained in the fluid distribution to constrain the understanding of processes that affect production. The level of confidence rises with the data quality and data availability. Acquiring high-quality data to map spatial variations of fluid properties across the field is an integral part of this methodology.
Stratigraphy and structure analysis, static-formation-pressure surveys, mud-gas analysis, isotope analysis, oil geochemistry, and solution-gas geochemistry are routinely used to assess compartmentalization. However, in spite of this array of methods, unrecognized compartmentalization remains one of the leading causes of production underperformance in the industry. A successful new method to address this issue is to assess if reservoirs fluids are equilibrated; if so, then reservoir connectivity is indicated. In particular, fluid compositional equilibrium is orders of magnitude more stringent than pressure equilibration in revealing reservoir connectivity. Moreover, it is now possible to determine independently whether gas/oil-ratio (GOR) gradients and asphaltene gradients are equilibrated. Specifically, the application of new asphaltene science in new wireline work flows allows the assessment of fluid equilibrium on the basis of the suspended solids in the oil: the asphaltenes. This new approach is based on different physics than is the industry standard of assessing the solution gases in oil. Frequently, it is the asphaltenes that provide the best method of analysis of reservoir connectivity. The case studies in this paper show the application of this new methodology in real-field examples.
For a discussion of the theoretical work behind the new work flows using DFA data to assess asphaltene gradients, please see the complete paper.
Case One
The operator drilled a discovery well and an appraisal well on the Norwegian continental shelf within a distance of approximately 2 km of each other. Fig. 1 shows a model of the reservoir setting. One sample and DFA station were acquired per sand, giving three data points in two wells. Oil-based mud-filtrate contamination varies from 3 to 6 vol%. The discovery well encountered oil-down-to in the upper sand. The lower sand was water bearing under a slightly higher aquifer pressure compared with the appraisal well. The appraisal well encountered oil-down-to in the upper sand and an oil/water contact in the lower sand.
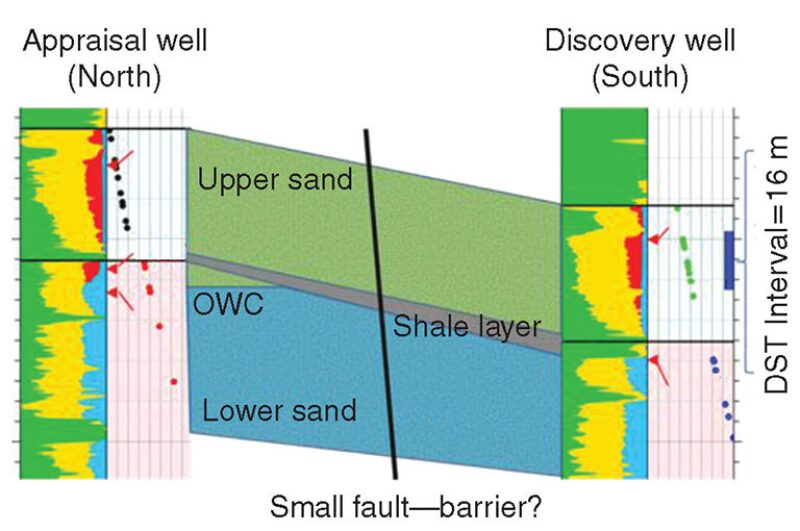
Static formation pressure found the upper sand in the appraisal well to be 1.2 bar lower than the upper sand in the discovery well. The aquifer pressure in the lower sand south seems to be slightly elevated. The 1.2-bar difference between the top two sands is unlikely to reflect DST-related depletion. Subseismic faults are suspected to be the reason that the drillstem test (DST) indicates boundaries close to the well.
The light-end comparison does not yield information allowing differentiation of the oils in the different parts of the reservoir. The DST sample commingles fluid from a 16-m interval. Saturates, asphaltenes, resins, and aromatics analysis shows 72 wt% saturates. Saturates are not good solvents of asphaltenes, which could explain the relatively low asphaltene content of 0.69 wt%. The low level of asphaltenes is confirmed by the low level of fluid coloration.
Fig. 2 shows the spectroscopy data of the three DFA/sample stations. The fluid coloration can be corrected for up to 10% of filtrate contamination with confidence. The mud filtrate is assumed to be colorless in the optical wavelength channels used here. After contamination correction and baseline correction, the data can be compared between stations. The optical density (after correction) is linearly related to the asphaltene content of the oil. Results indicate twice the asphaltene content in the upper sand south compared with the upper sand north and four times the amount of asphaltenes in the lower sand north. It is not common to see such a huge increase in asphaltene content in connected reservoirs except possibly at the base of the column, and that usually involves identified asphaltene instability.
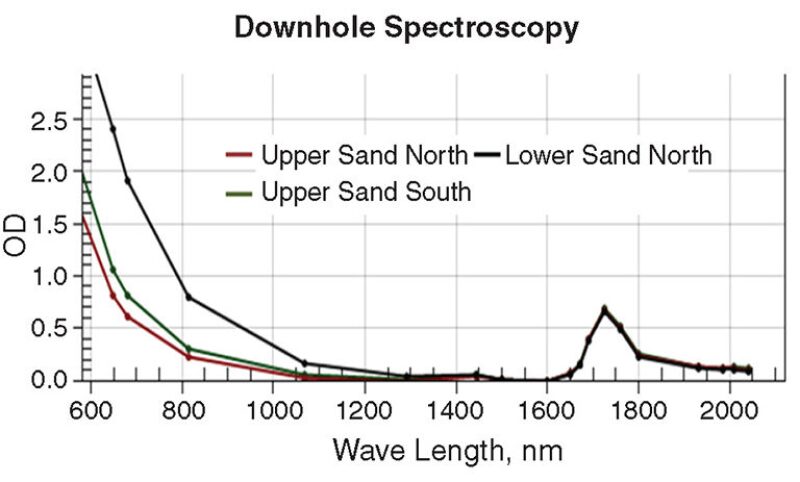
The small spread in the different prediction lines shows how variations in asphaltene size affect the equilibrium. With only three data points in two wells, it is not possible to establish a meaningful vertical asphaltene gradient that can be compared laterally. Nevertheless, the magnitude of the difference in asphaltenes supports the hypothesis of disconnectivity; it also negates the DST-depletion theory.
Case One shows the value of information of the DFA data beyond its sample-quality-assurance purpose. It also highlights that the data-acquisition plan needs to target compartmentalization to acquire a more-comprehensive data set in future applications.
Case Two
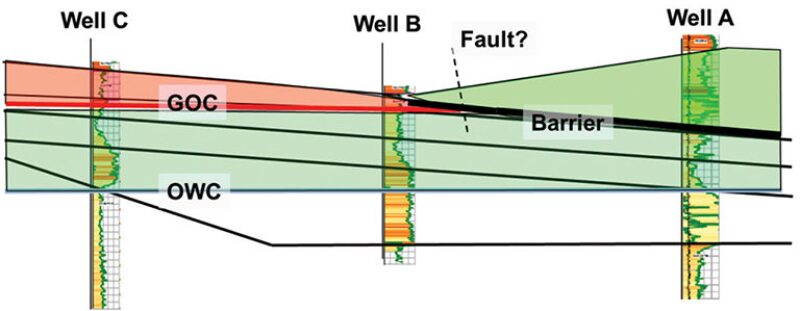
In this case, a different operator drilled an exploration well with several targets, where the secondary target was found to be oil bearing. The well encountered two pressure regimes. Other wells had been drilled in the same structure, and similar properties were expected. But this was not observed. The main pressure regime was slightly lower than that in the offset wells, and the PVT properties were different, including a different bubblepoint pressure. There was no gas cap encountered in this well. Vertical and horizontal connectivity are major uncertainties. The subsurface uncertainty revolves around subseismic faults and barriers (Fig. 3).
In Well A, oil was sampled at four different depths over a vertical extent of approximately 70-m true vertical depth. The static formation pressure fails to identify compartmentalization with confidence. The formation-pressure measurements fall on a single gradient with the exception of the fourth sand, which shows pressure to be 0.5 bar higher. This puts the fourth sand on the same pressure regime as the offset wells. Nevertheless, such a pressure difference is too small to support a confident assessment on discontinuity.
PVT analyses compare methane content, GOR, and carbon dioxide content of the different sample locations and with those of the offset wells. It is difficult to identify clear trends or to discern differences confidently. All of these assessments are based on vapor/liquid equilibrium. DFA helps to resolve ambiguity because it adds data that are based on different physics: the suspension of solids (asphaltenes) in liquid (oil). Three out of four measure points exhibit equilibrated asphaltene content that implies good vertical connectivity.
The fourth measure point exhibits a three-fold increase in asphaltene content. Its GOR is slightly lower, and the fluorescence signal is suppressed by the higher fluid coloration, corroborating the large color value. These measurements imply disequilibrium in the fourth sand. Together with all other log and pressure data, this implies discontinuity between this sand and the rest of the reservoir.
Fig. 4 summarizes the DFA and pressure measurements in Well A and its sidetrack. The sidetrack penetrated the top two hydrocarbon-bearing sands downdip in approximately 200 m of lateral distance. The pressure measurements in the sidetrack line up with the gradient in the main well.
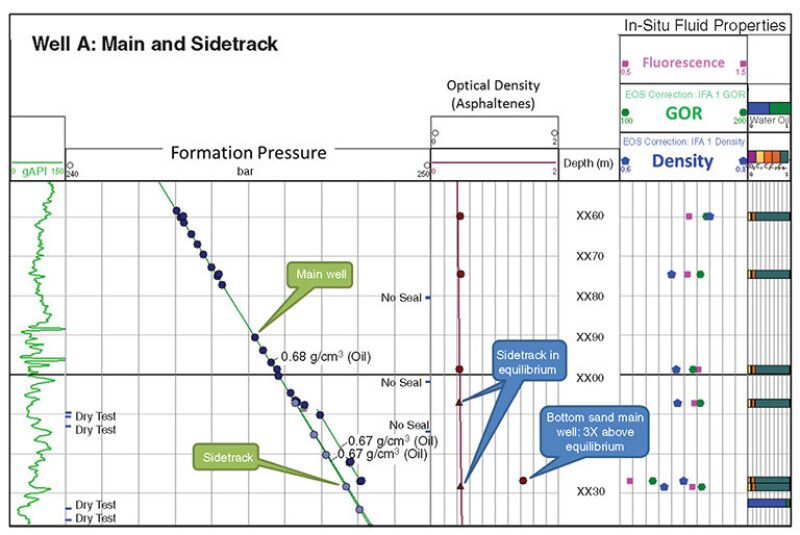
The asphaltene content (third track) matches that encountered in the top sand of the main well. This implies lateral connectivity in the top sands between the main bore and the sidetrack. The fourth track shows GOR in green hexagons, fluorescence in pink squares, and density in blue pentagons.
The comparison of the asphaltene content in concert with PVT and pressure data helped to delineate the most plausible of five reservoir models. The sequence of formations was thought to be different between Field A and Field B, but it was thought that Field B would contain the same fluids as Field A. The limited resolution of the seismic data does not resolve geologic features to assess connectivity. The static-formation-pressure survey followed by the DFA stations indicates the absence of the gas cap in Field B. This was not expected, and at this point, the depositional environment and geologic setting had to be rethought. Diligent vertical fluid scanning and assessing of the relative asphaltene content through DFA provide the pivotal evidence in this process. After integrating all formation-testing data, including the relative asphaltene content, it becomes clear that Fields A and B are separated. The presence of a vertical barrier between the top three sands and the bottom sand is also a prudent assumption.
This article, written by JPT Technology Editor Chris Carpenter, contains highlights of paper SPE 166204, “Fluid Profiling for Reservoir Evaluation: Two Norwegian Case Studies,” by Thomas Pfeiffer, Schlumberger; Vincent Kretz, BG Norge; Daniel Øpsen, Wintershall Norge; and Vlad Achourov and Oliver C. Mullins, Schlumberger, prepared for the 2013 SPE Annual Technical Conference and Exhibition, New Orleans, 30 September–2 October. The paper has not been peer reviewed.