Good primary recovery, high drilling cost, and facility limitations mean water injection is not commonly used in the deepwater Gulf of Mexico. However, waterflooding can supply additional reservoir energy for producing substantial quantities of oil trapped by limited displacement drive and poor sweep efficiency. This paper is a detailed examination of Pleistocene-to-Upper-Miocene turbidite reservoirs in the deepwater Gulf of Mexico under water injection. Waterflooding strategies have proved to be highly effective in achieving good incremental oil recovery from these reservoirs.
Introduction
So far, oil and gas production in the deepwater Gulf of Mexico is mostly from Neogene (Pleistocene, Pliocene, and Upper Miocene) reservoirs. The Neogene reservoirs can be characterized broadly as overpressured, unconsolidated, and highly compacting, with high permeability and containing black undersaturated oil of medium gravity with moderate gas/oil ratio and some aquifer support. Although waterflooding is a mature technology, few water-injection projects have been conducted in the Neogene reservoirs because they exhibit good primary recoveries, exist in high-cost offshore environments, and are relatively small. In some of these fields, a limited volume of water was injected. The fields with water injection are
- Petronius field—J1 and J2 reservoirs
- Mars field—N-O sand, M1/M1 sand, and E sand
- Horn Mountain—M sand
- Holstein—J2 and J3 sands
- Ram-Powell—N sand
- Ursa/Princess field—Yellow sand
- Morpeth field—M-2/P sand
- Amberjack field—G sand
- Bullwinkle—J2 sand
- Lena field
- Pompano (possibly a disposal project more than a waterflood)
- Lobster—Bul-1 sand
The Amberjack, Ram Powell, and Morpeth fields have had only short periods of water injection because of injectivity and sweep-efficiency problems. After approximately 4 years of injection, production at Bullwinkle exhibited sufficient pressure support from the aquifer influx that water injection was stopped. Extensive water injection, starting at the beginning of production, occurred only in the Petronius, Horn Mountain, and Holstein fields. In the Mars and Ursa/Princess fields, primary production was followed by water injection after the initial high reservoir pressure was depleted.
Petronius
First oil from the Petronius field was in 2000. Water was injected in two primary reservoirs, J1 and J2. Waterflooding began 7 months after the start of production because the reservoirs were slightly saturated (Fig. 1) and the reservoir system was under normal pressure and temperature. Reservoir J1 sand has a gas cap and modest rock compaction.
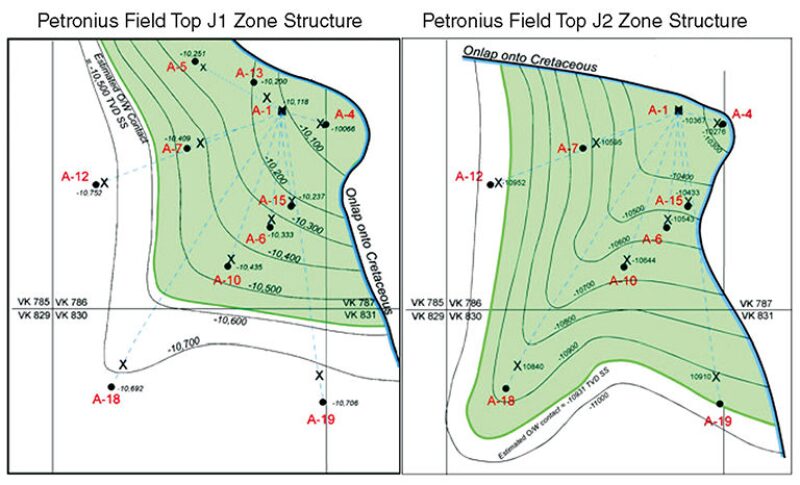
The productivity of the producers and the injectivity of the injectors in Reservoir J1 have been stable during its life, which indicates slowly declining reservoir pressure and improved sweep efficiency from injected water. The average injection rate reached 40,000 B/D. The water cut started to increase after water breakthrough in the middle of 2006, and the production rate has declined ever since. The high oil rates are sustained over time with adequate injection.
The waterflood is mature enough to allow good confidence in predicting ultimate recovery with decline-curve analysis. The ultimate recovery factors of Reservoirs J1 and J2 determined by decline-curve analysis are expected to be 65 and 60%, respectively, if the current production scenario remains unchanged. The recovery factors of depletion are estimated by material balance. The depletion recovery factors for Reservoirs J1 and J2 were 20 and 27%, respectively, because of poor energy support and possible three-phase flow because of slightly saturated fluid. Therefore, the incremental oil recovery from waterflooding is estimated to be 45 and 33%, respectively.
The peak injection rates are 49,000 and 44,000 BWPD and the average injection rates are 29,310 and 20,680 BWPD for Reservoirs J1 and J2, respectively, in the 12-year production history. In June 2012, the cumulative injections were 119 million and 69 million STB, respectively, which account for 66 and 45% of pore volume, respectively. Incremental oil for Reservoirs J1 and J2 is at 53 million and 28 million STB, respectively.
Above all, the fractured water injection sustained high oil-production and water-injection rates for pressure maintenance. From a reservoir-management perspective, water injection was obviously successful at Petronius.
Mars
Production in Mars field began in 1996 and peaked in June 2000 at 208,000 BOPD and 217 MMscf/D of gas. Current cumulative production is at 600 million BOE. It is expected that another 600 million BOE will be produced, for a total of 1,200 million BOE estimated ultimate recovery (EUR). The remaining depletion plan calls for another 50 years of production.
Mars field is a prime candidate for secondary recovery because the predicted primary recovery has limited aquifer support and the reservoir is overpressured and highly compacting. However, the reservoir is characterized by good vertical and horizontal permeability, structure relief, and connectivity. The waterflood objectives are to decrease the rate of pressure decline, not increase pressure; to prevent the M1/M2 and E sands from producing below their bubblepoints; and to reduce some of the compaction risks for well completions in the compressible formations.
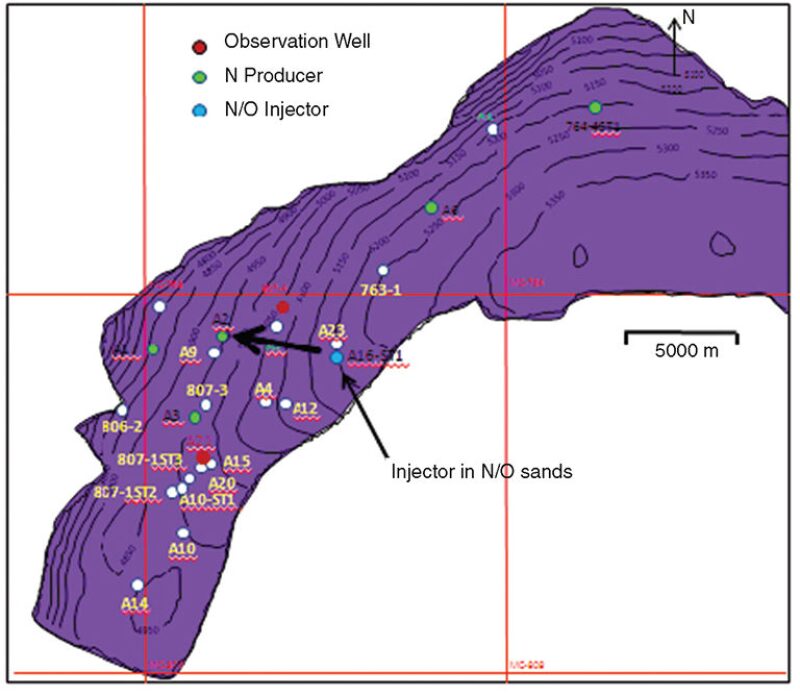
Seawater injection began in 2004 for three reservoirs—N/O sand, M1/M2 sand, and E sand—by three injectors (A12, A16, and A18). The current water delivery is 82,000 BWPD with a 6,850‑psi seven-stage-centrifugal-pump discharge for the three injectors. Up to June 2009, approximately 46 million bbl of water was injected. No significant seawater breakthrough has occurred; however, a reservoir pressure-response has been observed by well testing and production logging.
The N and O1/O2 sands are the major reservoirs in the Mars field. They were put on two-layer commingled production in June 1996. There had been no sign of water breakthrough up to the time the complete paper was written.
Natural aquifer influx is negligible, and time-varying compaction predominates. The production plateau is observed for more than 6 years, which suggests a large hydrocarbon volume and strong rock compressibility.
The injection started in the second quarter of 2004 with one injector (A16) (Fig. 2). The reservoir pressure was approximately 6,800 psia at that time, which is 4,505 psi below the original 11,305 psia. Approximately 23 million bbl of seawater has been injected to date. The injected-water voidage replacement is 0.022 pore volumes. The productivity index (PI) of the N sand was improved from 13.5 B/D/psi in 2004 to 21.8 B/D/psi in 2005; the PI of the O1/O2 sand went from 47 B/D/psi in 2004 to 55.6 B/D/psi in 2005. Crossflow between the two layers was observed through the difference in injectivity between the two sands. Current pressure in the N and O1/O2 sands is still above bubblepoint. Continuous injection was implemented from July 2006 to March 2010. The water injection appeared to stabilize the decline, and there was no increase in oil rate. The oil rate declined significantly after the injection stopped in March 2010. The EUR for the waterflood is found by taking the oil rate in June 2012 and applying the prior observed reservoir decline rate of 14% per year. A recovery factor is estimated at 47% for the N and O1/O2 sands, 35% for the M1/M2 sand, and 33% for the E sand.
Lobster
Most of the production from Lobster field is from the Pliocene Bulminella sand. First oil occurred in the summer of 1994. Oil production from 10 wells peaked initially at platform limits of 48,000 BOPD.
Rapid pressure depletion occurred after 1 year of production. Pressure maintenance was begun early at Lobster field by use of four downdip water injectors (A2STBP1, A11, A12, and A14) (Fig. 3). Water injection was first implemented in the west, then started a year later in the east. The drive mechanism for the field is rock compaction and moderate aquifer drive with waterflood support. After 2.5 years of injection, operation was intermittent. Injection was suspended in 2004, with a small cumulative injection of 17.5 million bbl or 0.04 hydrocarbon pore volumes.
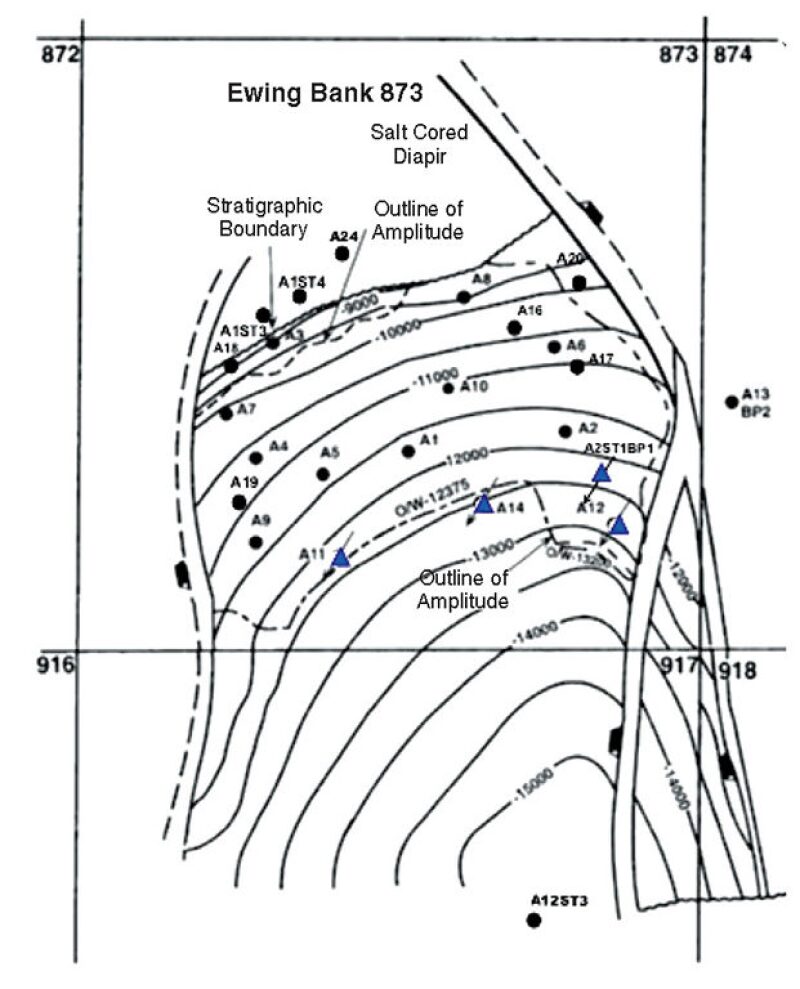
The primary-recovery factor estimated by material balance was 46% with 96 million STB of reserves because of moderate aquifer support and very strong rock compressibility. The waterflood EUR of 120 million STB and the 57% recovery factor are from decline-curve analysis. The waterflood incremental oil recovery is approximately 11% of original oil in place, which is not as significant as that of the Petronius J1/J2 sands and Mars N/O sand. The reason is strong rock compaction.
Future Waterflood Potential in Paleogene
Water-injection operations will be difficult to implement in tight, overpressured Paleogene reservoirs. The key driver in a successful waterflooding operation is to ensure a high rate of water injection to initiate sandface fracturing and overcome low permeability to propagate the induced fractures. It is important that the induced fractures be kept open to avoid requiring reinitiation. This is especially a challenge during regular shutdown periods. Conformance control is a prime concern in heterogeneous intervals several hundreds of feet thick, where highly conductive thief zones may be interbedded with pay. Significant water zones contained within productive horizons may call for water-shutoff techniques to manage the outflow from these multiple layers. Reservoir compartmentalization from faulting and the presence of stratigraphic barriers impose limits on waterdrive sweep efficiency.
Despite many drawbacks that tend to oppose the implementation of water-floods, Paleogene reservoirs are candidates for water-injection programs under the rules of good production practice. The high initial pressures of up to 19,000 psi, coupled with low saturation pressures, provide some leeway for commencement of pressure maintenance. Adding energy to the reservoir through injected water should begin immediately before drawdown reaches bubblepoint conditions. Injectivity will improve, but at the expense of overpressurization. Delaying injection until pressures are lower produces the benefits of both lower oil viscosity and increased oil volume from expansion. Avoidance of severe subzone differential pressure also factors into the timing for pressure support.
This article, written by Special Publications Editor Adam Wilson, contains highlights of paper OTC 24111, “Water Injection in Deepwater, Overpressured Turbidites in the Gulf of Mexico: Past, Present, and Future,” by X. Li and K.K. Beadall, SPE, Knowledge Reservoir; S. Duan, SPE, Chevron Corporation; and J.R. Lach, SPE, Knowledge Reservoir, prepared for the 2013 Offshore Technology Conference, Houston, 6–9 May. The paper has not been peer reviewed. Copyright 2013 Offshore Technology Conference. Reproduced by permission.