
The Southwest Kinsale (SWK) reservoir is part of the Kinsale Head reservoir in the Celtic Sea offshore Ireland. SWK was completed with three subsea wells tied back to the Kinsale Head platforms in 1999 (Well 3) and 2001 (Well 4 and Well 5). After initial depletion, SWK was converted to gas storage in 2001–02 and has been operated by PSE Kinsale Energy each year since. The storage is seasonal with injection in May to September and withdrawal principally from December to March. The nominal capacity is 8 Bcf with a maximum flow rate of approximately 95 MMscf/D.
Background of the Problem
The operation has experienced gas hydrate formation during the latter part of each withdrawal season since 2006. In 2011, the company decided to expand its storage business. Hydrate formation was identified as the key technical risk to that expansion. While the company has an excellent record of meeting withdrawal nominations, isolated incidences of hydrate formation have proved challenging. In March 2011, the company set up a structured program to understand and resolve the problem.
The majority of the withdrawal uses “free flow,” i.e., reservoir pressure, to generate gas flow over the 7-km distance to the Bravo platform, which has a choke and flowmeter, and thereafter, the 5-km distance to the Alpha platform, where the withdrawn gas is processed by separation and triethylene glycol (TEG) dehydration. From there, the gas travels another 50 km to the shore terminal. The flow can be boosted during peak demand in the latter part of withdrawal by a boost compressor upstream of the TEG dehydration. Production gas from other reservoirs commingles upstream of the TEG process.
There is neither downhole pressure nor temperature indication in the wells, nor is there a downhole chemical dosing point. On each Christmas tree between the master and wing valves, there is a chemical injection point (fed by two umbilical cores), a pressure sensor, and a temperature sensor. The hydrate inhibitor historically used was methanol (MeOH). No corrosion inhibitor is injected. The wells are in 90 m of water and completed at approximately 900 m total vertical depth below mean sea level. The reservoir temperature is approximately 27°C. Wells 4 and 5 are deviated while Well 3 is vertical.
The Experience With Hydrate
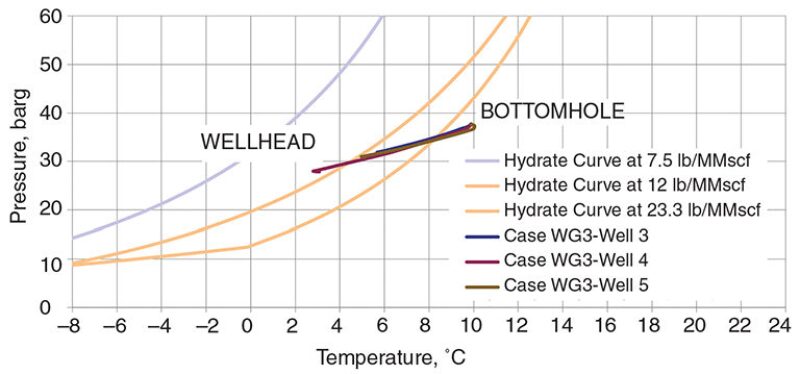
The native gas is lean at >98% methane and 0.2 mol% CO2, with predicted hydrate formation temperature of 4.5°C at 30 bar at typical water saturations (Fig. 1). Operating wellhead flowing pressures (WHFP) range from approximately 45 bar to 80 bar. Hydrate incidences appear to be occurring more frequently. The tendency for hydrate to form is compounded by progressive enrichment by the comparatively rich network gas injected into the formation each year. Historically, identifying hydrate incidences was hampered by frequent changes in flow rate because of operational and commercial requirements.
Production operations work had identified several possible causes of hydrate. The first occurs on the Bravo topsides choke and flowmeter run. This was mostly resolved by removing the flow straightener. Any current incidences of topsides hydrate are detected by flowmeter noise or a decrease in flow accompanied by rising WHFP. Local MeOH dosing or small actuations of the choke are used to resolve the problem.
The second hydrate formation region appeared to be in the well areas. Some background on the issue follows.
Studying Hydrate Formation
The first task was to develop a tool to predict the withdrawal flow capacity. Company reservoir engineers used a simple material balance model and developed this to account for the particular reservoir behavior, including compartments and regional connectivity. The result was a spreadsheet tool that reliably predicted flow capacity (+/– a few percent) at given WHFP and for a particular reservoir condition of gas in place and flow history. While the tool enabled operations to identify incidences of reduced throughput (indicating hydrate formation), it did not indicate where the hydrate was forming or provide knowledge of why it was forming.
The operating procedures to remove the hydrate were not consistently effective and consisted of shutting in the wells by closing the wing valve and injecting MeOH into the wellbore. “Normal” shut-in pressure was achieved on several occasions. However, the flow remained impeded, indicating the difficulty of verifying removal of hydrate plugs. There were also several instances in which hydrate plugs had formed but porosity allowed some flow to continue.
Early flow assurance work suggested that the wells should be operated at low pressure, below the hydrate formation curve (Fig. 1). An attempt in March 2011 to operate at the lowest possible pressures (20 bar) by “cold starting” the compressor to draw down the pressure of two flowing wells, following several days of shut-in, was unsuccessful. Hydrate started to restrict the flow noticeably within 2 to 4 hours, despite injection of significant levels of MeOH into the wells beforehand. It was evident that the MeOH had evaporated too quickly to inhibit hydrate formation sufficiently.
During February and March 2011, the apparent hydrate order of the wells was observed. Flow assurance work was initiated using a standard commercial dynamic flow assurance software package to model the wellbore and heat transfer into the surroundings. The modeling corroborated the observed hydrate tendency. The longer deviated wells with nitrogen in the annulus were more prone to downhole hydrate than the vertical well with annular brine. The higher flowing deviated well was repeatedly the first to experience flow restriction.
An analysis of the Christmas tree temperature responses showed that the two functioning devices were measuring different variables. The relatively invariable device on Well 3 measured seabed conditions (verified by seasonal temperature variation), whereas the apparently unstable device on Well 4 measured flowing temperature (the temperature decreasing with increased flow and equalling Well 3 when there was no flow). Well 4 was also the first to form hydrate. This enabled an analysis of wellhead flowing temperature (WHFT) to detect hydrate formation in the upper wellbore. Decreases in WHFT during otherwise steady flowing conditions indicate Joule-Thomson expansion across a hydrate restriction and enable the operator to identify hydrate formation.
Further WHFT observations included a dynamic temperature response after shut-in, whereby the temperature decreased and “undershot” the seabed temperature by 1.5°C to 4°C before returning to a steady-state temperature. It was also noticed that the flowing temperature varied throughout the season. A simple radial reservoir model was simulated in a standard commercial software package with a thermal-compositional module. The work demonstrated the effect of injecting gas at seabed temperatures and how the temperature of the subsequent withdrawal gas varied at postulated bottomhole conditions. The bottomhole temperature progressively decreased over five storage cycles from 24°C to 21°C.
In combination, the observations and studies agreed that the hydrate tendency had increased over the storage operation cycles and suggested that an alternative hydrate inhibitor would be more effective. The choices considered were TEG and methylene glycol (MEG). TEG is the more viscous of the two and has a lower vapor pressure. Modeling of the inhibitor loss caused by evaporation indicated that TEG would form a thicker film than MEG and persist longer downhole. MEG is not compatible with the TEG dehydration system because it will acidify in the regeneration system. Thus, despite the advantages of MEG in cost and inhibition efficiency, TEG was selected.
The TEG-MeOH Trial
In early February 2012, the withdrawal flow was restricted because of hydrate in line, yielding all the observations cited above regarding well hydrate tendencies, the WHFT decrease, and the capacity tool. The MeOH dosing was unable to remove the hydrate. The operation was forced to revert to lower flow, which at the higher flowline pressures also meant warmer gas and, therefore, hydrate dissociation.
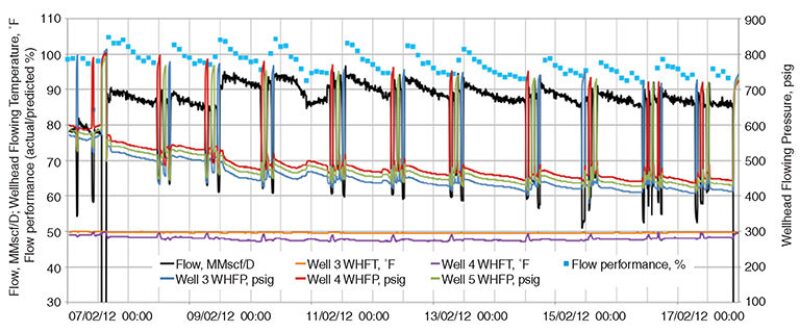
In mid-February, a quantity of 70% TEG (cut with MeOH to reduce its viscosity to suit the existing pump specification) was injected at 18- and 24-hour intervals. The dose quantity was 20 US gal injected over approximately 50 minutes. This dose was calculated to create a film coating of approximately the upper 100 m of each well (tubing diameter 5½ in.). This was the target region of the wellbore because the downhole safety valves on the three wells were at approximately 100 m subsurface. Performance was tracked by comparing the achieved flow with the predicted flow for the WHFP.
Two dose intervals were longer than 24 hours (as long as 30 hours). It was found that these extended dosing intervals reduced the flow performance afterward. Also, during the run, the compressor speed was used to increase the flow rate. The performance was always able to achieve >92% of the predicted flow rate (Fig. 2). Repeatable performance with TEG-MeOH was demonstrated. Before the switch to using TEG-MeOH, the high-flow operation had only lasted 5 days before a significant hydrate event.
More tests corroborated the repeatability of the TEG dosing operation. This included a “dummy dose” when the wells were shut in as if they were dosed with the TEG-MeOH but were not. When the wells were reopened, there was an increase in flow (compared with the flow before shut-in). However, the flow reverted to the rate before shut-in within 2 to 3 hours. This showed that a) the diurnal variation in flow rate was not caused by reservoir effects, b) a hydrate did form during the interval between doses, and c) the TEG-MeOH dosing was controlling the hydrate.
2013 Operations
In summer 2012, the TEG-MeOH injection system was reinforced with a larger capacity pump and the process piping was rearranged to allow a continuous flow during compressor startup. A new infrared moisture analyzer was installed. During the hydrate risk period in the 2012–13 winter withdrawal season, the TEG-MeOH injection was rigorously applied at 24-hour intervals. The above refinements minimized the shut-in durations, thereby minimising cooling of the upper wellbore.
The topsides moisture analyzer showed a dehydration effect because of the injected chemicals, pointing to further reduction of hydrate formation risk. Operationally, the TEG-MeOH injection resulted in additional liquid volumes in the inlet separator, with the volume separated amounting to about 80% of injected volume. Previous dosing with equivalent volumes of methanol had yielded practically no separator liquids.
Winter withdrawal has recently concluded without a single hydrate incident. The confidence in the operation helped the operator to maximize uptime, and extra gas was available for withdrawal from storage during the March cold weather period.
Conclusion
The operation concluded that batch dosing TEG-MeOH allows control of downhole hydrate in a subsea gas storage well that has no downhole dosing capabilities. The intervention has allowed the operator to reliably meet peak customer demand in the highest risk period of storage gas withdrawal.