
The Golden State’s Monterey formation has been garnering a great deal of attention as a possible emerging liquids-rich shale resource that not only rivals plays such as the Bakken and Eagle Ford but towers above them in potential. Where did this news originate, what does it mean, and how does the Monterey’s future seem to be unfolding?
An Intriguing Report
In July 2011, the US Department of Energy’s (DOE) Energy Information Administration (EIA) issued a report titled “Review of Emerging Resources: US Shale Gas and Shale Oil Plays.” The introduction to the report clarifies that it is presenting a review of such resources only within the US lower-48 onshore area. The information presented in the review is based on a report, with the same title, which was prepared by INTEK, Inc. for the DOE, and is dated December 2010.
The report identifies 19 significant shale gas plays in the US onshore lower-48 area—plays labeled, in a table, as “unproved discovered technically recoverable resources.”
It also named four significant shale oil plays in the US onshore lower-48 area—plays labeled, in a second table, as “technically recoverable resources” (i.e., not “unproved and discovered”). These shale oil plays are identified as the Eagle Ford; the Avalon and Bone Springs (within the Permian Basin); the Bakken; and the Monterey/Santos.
The Monterey/Santos play was estimated, according to the report, to contain 15.42 billion bbl of technically recoverable shale oil resources, amounting to around 64% of the total resources in the four shale oil plays examined. This estimate has generated significant interest, due to its vastness, particularly when weighed against current heated shale oil activity in the three other shale oil plays cited.
Overall US crude oil production has risen steadily since the month the report was issued, from a July 2011 average of approximately 5.6 MMB/D to a December 2012 average of 7 MMB/D. According to EIA monthly statistics, which are derived from a combination of estimates and actual data reported by federal and state agencies (with estimates supplanted by actual data as reported data gradually become available over time), increasing oil production in North Dakota (the Bakken) and onshore Texas (Eagle Ford and Permian Basin) drove the surge in overall US crude oil production.
Increased oil production stemming from the Monterey/Santos play has yet to materialize.
Probing the Numbers
The estimate of Monterey/Santos play riches has spread throughout the press since July 2011. It generated local interest in California—in the Bakersfield Californian (9 June 2012: “Monterey Shale Brightens Kern’s Oil Prospects,” by John Cox) and City Journal (Summer 2012: “California Needs a Crude Awakening,” by Tom Gray). It spread into more widespread oil and gas industry attention, such as in the American Association of Petroleum Geologists (AAPG) Explorer (November 2012: “The Monterey Shale: Big Deal, or Big Bust?” by David Brown).
It has made its way more recently into broad public purview via the New York Times (3 February 2013: “Vast Oil Reserve May Now Be Within Reach, and Battle Heats Up,” by Norimitsu Onishi), The Motley Fool (6 February 2013: “Betting on the Monterey Shale,” by Jake Mann), and Forbes Magazine (4 March 2013: “Chevron: The World’s Biggest Gusher,” by Christopher Helman).
Given the pervasive reliance on the EIA’s estimate of Monterey/Santos play resources—and of the fact that the estimate dwarfs those of all other major US lower-48 liquids-rich shale plays combined—examining the basis of their derivation would be important.
The report estimates the total active Monterey/Santos play area at 1,121,500 net acres. Five companies are listed as being “Monterey/Santos lease holders,” with net acreage as follows:
- Berry Petroleum – 6,500
- National Fuel Gas Company (NFG) – 14,000
- Occidental Petroleum Company – 873,000
- Plains Exploration and Production – 70,000
- Venoco – 158,000
This same list of companies—with the same net acreage, with one exception (i.e., Venoco’s net acreage is listed at 155,000)—can be found on slide #4 of a 26 May 2010 Venoco presentation titled “Monterey Shale Focused Analyst Day” (http://static.ewg.org.s3.amazonaws.com/reports/2012/fracking/ca_fracking/Venoco_slides.pdf). In addition, in the Venoco presentation, the NFG and Plains net acreage numbers were noted as being based on Venoco internal estimates of these companies’ potential Monterey acreage.
In the section titled “Monterey/Santos Shale Oil Play,” the EIA/INTEK report states, “Based upon these lease holdings, the total active area is calculated at 1,121,500 net acres (1,752 square miles).” This estimate appears to have no other source than the slide included in the Venoco presentation.
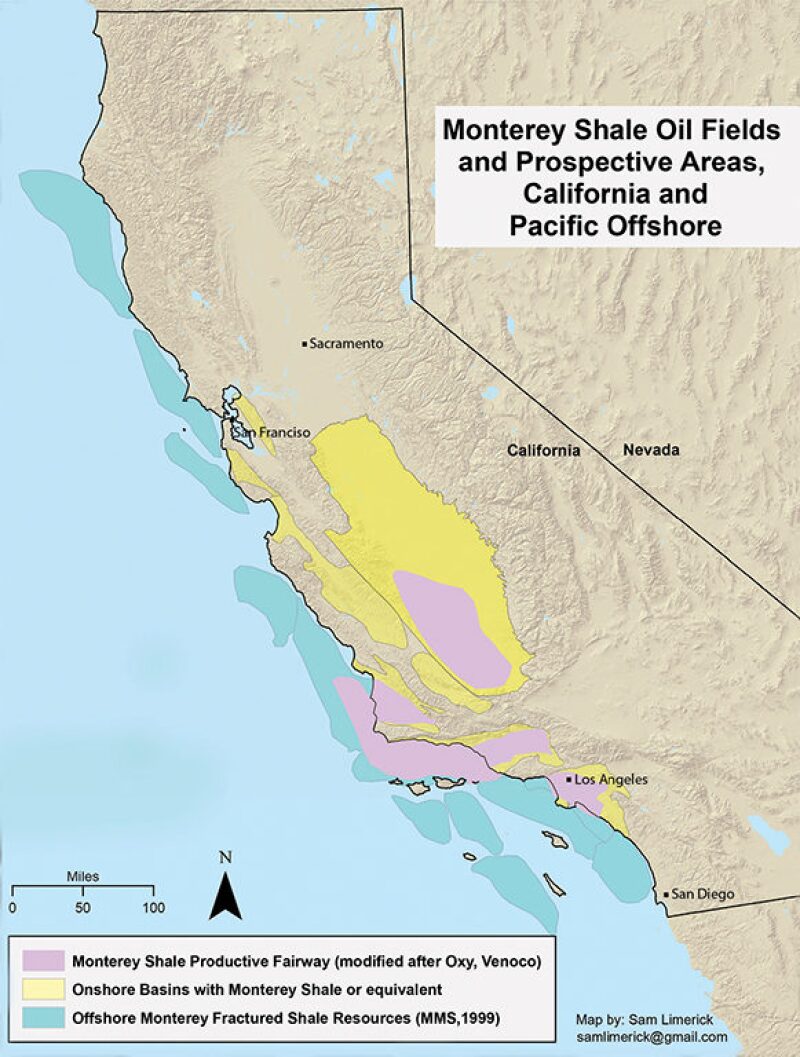
Nonetheless, without mentioning any other companies that might be involved in such a play and providing no other delineation of the “Monterey/Santos” play than a map in Figure 32 that appears to indicate Oxy “shale production” acreage both onshore and offshore California, Table 57 in the EIA/INTEK report lists the “Monterey/Santos active area” as the summation of the acreage amounts, converted to square miles, originally listed in the Venoco presentation—1,752 square miles.
The report estimates that the Monterey/Santos play is between 1,000 and 3,000 ft thick at a depth ranging from 8,000 to 14,000 ft—far greater than the known thickness of the Bakken, at a thickness ranging from 55 to 150 ft, and the Eagle Ford, at a thickness ranging from 200 to 300 ft. Its Table 57 lists the average estimated ultimate recovery (EUR) for each Monterey/Santos well as 550,000 bbl of oil. Well spacing is estimated at 16 wells per square mile. On the basis of this calculation, 550,000 (bbl) is multiplied by 16 (wells) times 1,752 (miles) for an estimated 15.42 billion bbl of oil that is listed as the Monterey/Santos play’s technically recoverable resource.
Referring to the report’s “Table 1—INTEK estimates of undeveloped technically recoverable shale gas and shale oil resources remaining in discovered shale plays as of January 1, 2009,” the “Monterey/Santos shale play” is listed as containing 64% of the US onshore lower-48 shale oil resources. This percentage—and the 15.42-billion-bbl resource it is based on—is astounding, far overshadowing estimates for the Eagle Ford, listed in Table 1 at 3 billion bbl; the Avalon and Bone Springs (Permian Basin), listed at 2 billion bbl; and the Bakken, listed at 4 billion bbl.
However, activity in the Eagle Ford, Permian Basin, and Bakken liquids-rich shale plays is undoubtedly under way and contributing the lion’s share of recent increases in US domestic crude oil production. To date, similar activity pointing to a Monterey/Santos play is not forthcoming.
The list of the technically recoverable resources for a shale oil play called in the EIA/INTEK report the “Monterey/Santos” appears to point directly to the Venoco slide presentation. Also, the US Geological Survey has done no assessment or evaluation of this play. And finally, there does not appear to be any source that gives a geologically based assessment of a play called the “Monterey/Santos.”
It therefore appears that the EIA/INTEK report’s Monterey/Santos shale oil play assessment has a weak foundation.
Comparative Monterey Research
Looking at the EIA/INTEK report derived numbers in some sort of comparative manner, an analysis published by Raymond James also in December 2010 covers much the same material as the EIA/INTEK report. It is upfront about basing much of its discussion on Venoco’s and Occidental’s 2010 May analyst day presentations.
With a conservative 2% recovery factor of estimated original oil in place (OOIP), Raymond James comes up with an EUR of 1.7 million bbl per 640 acres (1 square mile). Given the EIA/INTEK total acreage number, this works out to represent technically recoverable resources of approximately 2.98 billion bbl for the entire play. Given the Raymond James report estimate of the play’s total net acreage (based on adding up the Monterey shale net acreage positions of seven—not five—companies) of 1,200,200 (around 1,875 square miles), the entire play’s total technical recoverable resource works out to be 3.19 billion bbl.
The Raymond James report states further, “Assuming 115‑acre spacing per well (the average of Venoco’s internal estimates across the entire play), we calculate as little as 127,000 bbl per well at 1% and up to 696,000 bbl at 4% recovery.” This translates into 5.56 wells per square mile (not 16 as in the EIA/INTEK report). Taking the simple average of Raymond James’ low and high recovery numbers, the EUR per well works out to be 411,500 bbl. Given the EIA/INTEK total acreage number, this translates into approximately 4.00 billion bbl of technically recoverable resources for the entire play. Given the Raymond James report estimate of the play’s total extent (1,875 square miles), this works out to represent approximately 4.28 billion bbl of technically recoverable resources for the entire play.

The two reports’ technically recoverable resources estimates for the entire Monterey shale play are vastly different—a contrast between the EIA/INTEK report’s 15.42 billion bbl and a Raymond James report derived range of between 3.19 billion bbl and 4.28 billion bbl. (Also, within its 2010 slide presentation, Venoco’s estimate of recoverable oil from Monterey fields is stated as 2.5 billion bbl—again, nowhere near the 15.42-billion-bbl estimate.)
No updates to either report have been issued. (In addition, in early October 2012, Venoco closed a going-private transaction. No information from the company has been released to the public since that time.)
As stated previously, industry and public media speculation about an apparent Monterey shale play has largely been based on the EIA/INTEK report.
The real value of the EIA/INTEK report, however, may lie in exploring the questions it gives rise to. This may yield insight into the need for a focus on what may or may not be a vast untapped source of crude oil.