
Production from the Bakken and Three Forks formations within the Williston basin is continuing to climb as a result of applied horizontal drilling and hydraulic fracturing. Key to increased oil production is the evolution of reservoir-stimulation techniques, such as fracturing-fluid systems and proppant types. This study evaluated the key factors that may result in conductivity loss within the Bakken and Three Forks reservoirs. The results of this work suggest that certain fluids may affect both rock and proppant strength and, therefore, require consideration.
Introduction
This work was conducted in an effort to answer questions regarding reservoir stimulation in the Bakken petroleum system, specifically with respect to conductivity loss in hydraulic fractures over time. The key questions that were evaluated include
- Can conductivity loss be attributed to proppant degradation, rock strength, or both?
- What role do fluids have in affecting propped-fracture conductivity?
- To what extent does fluid exposure affect the degradation of rock strength and proppant performance?
- How do various proppants perform relative to one another under stress using actual core samples from the Bakken petroleum system?
Laboratory tests were conducted to evaluate the sensitivity of Bakken and Three Forks formation cores to various fluids; to evaluate the strength of Ottawa sand, an unspecified premium precured resin-coated sand (RCS), and a lightweight ceramic proppant (Econoprop) with respect to various fluids; and to measure the relative laboratory conductivity performance of propped fractures using actual rock core. Fluids used in experiments to examine potential strength degradation for both rock and proppant included the following:
- Slickwater—a mixture of polyacrylamide and fresh water
- Crosslinked gel—guar-polymer thickening agent, borate crosslinker, and fresh water
- Gelled diesel—diesel fuel and phosphate ester
- Bakken-formation crude—crude oil
- Bakken-formation brine—highly concentrated saltwater
The fluids were selected on the basis of the most common fluids expected to be encountered in the Bakken formation.
Embedment
Brinell-hardness-index testing is a measure of rock strength that is determined by embedding a metal ball into formation rock at a given applied load. This type of index testing was used to gauge the relative strength of Bakken and Three Forks samples before and after exposure to formation and hydraulic-fracturing fluids.
Core samples used to study rock strength originated from the North Dakota Industrial Commission (NDIC) #16771 well, located in the Manitou field of Mountrail County. Rock strength was measured with a Brinell-hardness-test apparatus. Publicly available hardness data were available from two wells in proximity, including
- NDIC #15986, Robinson Lake field, Mountrail County, approximately 10 miles to the southeast
- NDIC #16083, Capa field, Williams County, approximately 10 miles to the southwest
Brinell hardness for the Upper Bakken shale from the deeper well, NDIC #15986, tended to be softer at the top of the formation (<20) and harder approaching the Middle Bakken. Middle Bakken hardness ranged from 20 to 35. The shallower well (in Williams County) has a hardness of <20, with an average of 20 for the Middle Bakken, and a significant variation of hardeness in the Three Forks ranging from 5 to 30.
The hardness results for core samples from NDIC #16771 are higher in magnitude compared with those for NDIC #15986 and NDIC #16083. However, the relative nature of the results provides similar characteristics in that the Lower Bakken shale is soft, Middle Bakken samples are harder, and Three Forks samples are highly variable. Bakken shale hardness results are generally half the hardness of the Middle Bakken formation, and the Three Forks formation hardness varies significantly.
The variation in Brinell hardness in the Three Forks formation is likely a manifestation of the properties of the interbedded nature of the green shales and sandstones.
Middle Bakken formation, Lower Bakken shale, and Three Forks formation samples were exposed to fluids at 250°F and 3,000 psi for 30 days. Middle Bakken samples appeared to experience a general decrease in average strength when exposed to slickwater, crosslinked gel, and formation water. Notably, slickwater had the greatest effect on rock hardness. Lower Bakken shale samples appeared to experience a similar decrease in hardness relative to slickwater and cross-linked gel, with slickwater having the dominant effect.
The variability of the Three Forks formation introduces data scatter and difficulty in making a statistically valid conclusion; however, slickwater appears to produce a notable decrease in rock strength for Three Forks samples.
The results of exposing the three rock formation samples to the various fluids and respective hardness testing reveal that the slickwater formulation decreased the strength of the formation face. The corresponding average decrease in Brinell hardness is as follows: 56% for Middle Bakken, 34.1% for Lower Bakken, and 84.3% for Three Forks, suggesting that, on average, the formation face could lose half of its original hardness after exposure to slickwater.
Proppant Strength
To evaluate proppant strength, a method was devised in which the elastic properties of the proppant pack were measured by plotting the stress vs. strain of a proppant pack in a cylinder that is 1 in. in diameter and 0.4 in. deep, loaded at approximately 4 lbf/ft2. This loading density of 20/40 proppant included eight to nine layers of proppant stacking. Although not representative of actual proppant loadings in the field of approximately 1 lbf/ft2, the additional layers ensured the ability of the apparatus to capture the elastic movement of the proppant pack, which can be measured before crush occurs. The characteristics of proppant strain could then be compared in both the elastic and plastic regions of the stress/strain curve to provide a description of the mechanics of the proppant pack as an elastic material.
Ceramic proppant displayed a high stiffness, with cleaving beginning to occur in the range of 9,000–10,000 psi. Sand appeared less stiff than ceramic but more stiff than RCS at less than 7,000 psi. Greater strain was associated with the RCS at less than 7,000 psi when compared with the noncoated sand; however, RCS exhibited good resistance to strain at stresses greater than 7,000 psi. No noticeable immediate failure was evident with RCS as compared with ceramic proppant at stresses in the 9,000- to 10,000-psi range. The relative increase in stiffness at the end of the curve for sand at 9,000 psi is likely because of the consolidation of particles and accompanying reduction of porosity.
Proppants were reacted with -fluids for 30 days at 3,000 psi and 250°F. Sand proppants did not appear to exhibit a significant change in elastic behavior relative to the average baseline curve, with the exception of sand exposed to Bakken formation brine. The formation-brine concentration was greater than 250,000 mg/L. The salts likely compromised material stiffness in the elastic range, or salt adhered to the surface and permitted more strain to occur at lower stress. Fluids reacted with RCS appeared to produce a decrease in stiffness when compared with the average for the unreacted RCS. Notably, formation water, crosslinked gel, and crude had the greatest effect. It appears that resins were affected by fluids and, at high stress, began to produce strain equivalent to that of sand. Fluids reacted with ceramic proppant did not appear to compromise proppant stiffness. Notably, the proppant reacted with formation water tended to have greater strain than the baseline. Collectively, for all proppants, greater strain was a consequence of exposure to formation water.
Conductivity
Fracture conductivity can be affected by many factors. High closure stress can crush proppant, embed the proppant into the rock, and generate fines that reduce permeability. Cycling of stress that occurs during well shut-in can also decrease conductivity irreversibly.
Fracture conductivity is calculated from Darcy’s equation. A standard-fracture-conductivity test is conducted in an American Petroleum Institute conductivity cell in which flow and differential pressure are recorded to determine conductivity under a specified confining load. Standard tests are normally conducted at durations of 50 hours.
With the exception of non-Darcy and multiphase flow, one of the most significant parameters likely to affect fracture conductivity is fracture-closure pressure. Fracture-closure pressures in the Bakken formation can be on the order of 9,500 psi for basin-centered locations and lower in shallower locations. The Elm Coulee field in Montana has been described as having fracture gradients of 0.69–0.75 psi/ft, initial pore-pressure gradients of 0.5 psi/ft, and bottomhole temperature of 240°F at 10,000 ft. Given the high degree of reservoir-pressure variability in the Bakken, a low stress (6,500 psi) and a high stress (8,000 psi) were selected for conductivity testing at a temperature near 200°F.
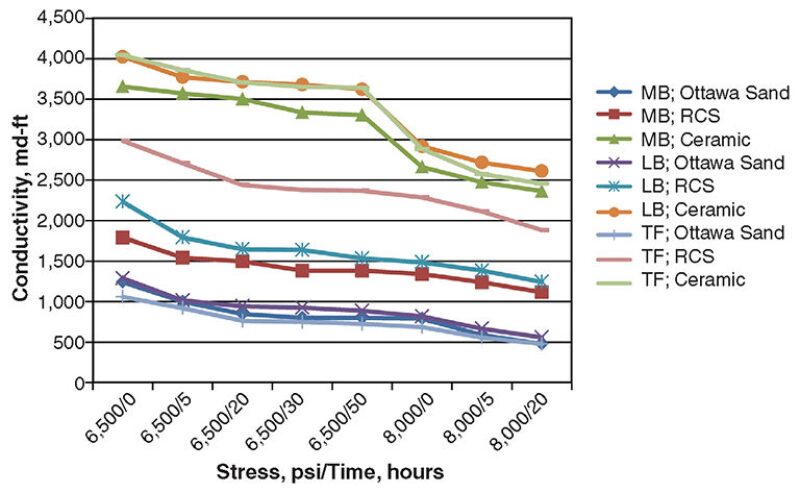
The results of the standard conductivity testing indicate that, regardless of rock type, the ceramic proppant exhibited the highest conductivity, followed by RCS, followed by Ottawa sand (Fig. 1). These results are consistent with the strength tests conducted. Very little variance in conductivity was evident between the rock types, despite the higher Brinell hardness associated with the Middle Bakken and Three Forks formations when compared with the Lower Bakken shale.
Conclusions
Proppants exposed to Bakken formation water (brine) consistently experienced the greatest increase in strain relative to proppants that are not exposed. The strength of RCS appeared to be affected detrimentally by all fluids, as compared with sand and ceramic. Fluids that have the greatest effect on RCS included crosslinked gel and formation fluids (crude and brine). Crush-test results were consistent with elastic-strength results for the various proppants and fluids; resin-coated products do not normally produce a large quantity of crushed particles.
All types of proppants have been used in the Bakken formation. While anecdotal evidence suggests that sand is an effective proppant in some areas of the Bakken, the results of this work demonstrated that the ceramic proppant was relatively unreactive and exhibited strength characteristics superior to those of the other proppant types following fluid exposures. RCS proppants are normally chosen to help prevent proppant flowback. However, these experiments suggest that fluid reactions with resin change the stress/strain relationship for RCS and that fluid considerations are important relative to the chosen resin.
The examination of the hardness testing in concert with the proppant strength revealed that consistency could be found relative to gelled diesel, in that very little effect was evident after exposure to formation rocks and proppants. No particular fluid produced a consistent degradation of both core samples and proppant, although crosslinked gel had a less pronounced detrimental effect on RCS and rock strength.
The results of the conductivity testing demonstrated that at effective-stress ranges from 6,500 to 8,000 psi, the ceramic proppant exhibited much higher conductivity than Ottawa sand (as much as five times greater) and moderately higher conductivity than the RCS (as much as 2.3 times greater).
Overall, the results of this study indicated that fluid exposure may affect both rock and proppant strength and needs to be considered in the field. In addition, conductivity decreases within the Lower and Middle Bakken appear to be a function of a variety of factors, including proppant and rock strength as well as formation embedment and spalling. Formation embedment and spalling appeared to be less significant within the Three Forks formation. This study also highlights the need for conductivity testing using actual formation or fracturing fluids, coupled with quantification of formation embedment and spalling.
This article, written by Special Publications Editor Adam Wilson, contains highlights of paper SPE 163849, “Investigation of Improved Conductivity and Proppant Applications in the Bakken Formation,” by Bethany Kurz, SPE, Energy and Environmental Research Center, Darren Schmidt, SPE, and Phil Cortese, SPE, Weatherford, prepared for the 2013 SPE Hydraulic Fracturing Technology Conference, The Woodlands, Texas, USA, 4–6 February. The paper has not been peer reviewed.