Drillstem testing of low-permeability reservoirs is challenging because high-pressure drawdown around the wellbore lowers fluids below saturation pressure and creates two-phase flow into the wellbore. The fluids produced at surface no longer represent the original reservoir fluid. This paper shows the benefits of a careful methodology of data selection and equation-of-state (EOS) modeling to validate data used to characterize the reservoir fluid.
Introduction
There are significant technical difficulties in capturing representative fluid samples from tight formations. Attempts to flow to surface from tight formations induce a fall in pressure around the wellbore that may take the reservoir oil or gas below its saturation pressure. Two-phase flow in the wellbore can cause significant errors for sampling downhole, although surface sampling can be less prone to error. However, because the gas within the formation is more mobile than liquid, the surface gas/oil ratios (GORs) are higher than those of the native fluid. This can lead to erroneous assumptions about the reservoir fluid if the separator samples are recombined to the prevailing GOR without reference to what is happening in the reservoir.
Two case studies are presented that resolve apparently conflicting data and use a wider range of well-test data than single data points to define reservoir fluids. Neither study had the benefit of downhole pressure/depth gradients to corroborate reservoir-fluid properties.
Characteristic Test Results for Tight-Formation Drillstem Tests (DSTs)
DSTs performed where the flowing bottomhole pressure (FBHP) stays above saturation pressures are ideal for surface sampling or for taking bottomhole flowing samples. However, the low deliverability of tight-formation wells often makes it difficult to establish stable flowing conditions. The FBHP, flowing wellhead pressure, and separator conditions may all be unstable, causing difficulties in establishing the correct GOR even when the total wellbore composition is constant. A further complication can arise if the gas rates are too low to lift liquids to the surface.
GORs for bottomhole samples (BHSs) are measured in the laboratory by flashing the sample to specified conditions. The same wellstream composition sampled at the surface will normally have a lower GOR because separator conditions favor an increase in stable liquid volume. Surface and bottomhole GORs will match only under identical flashing conditions. Typical GOR characteristics for BHSs and surface samples for a tight formation containing oil are shown in Fig. 1.
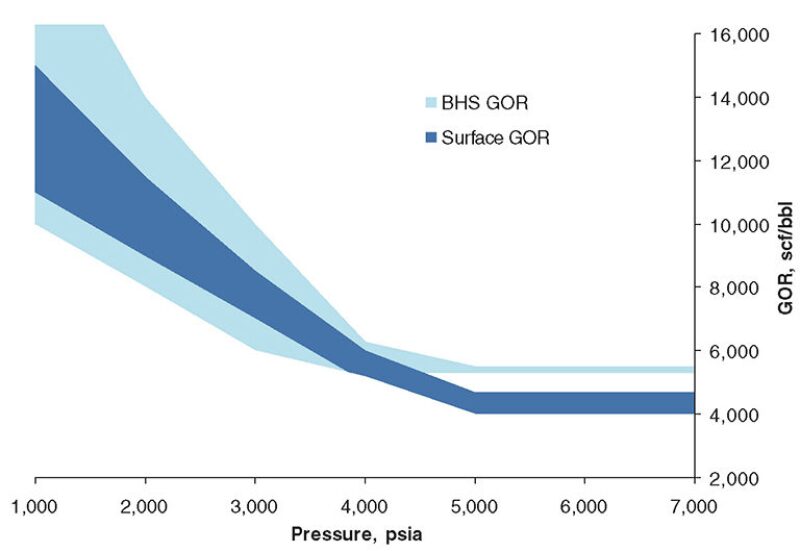
When the FBHP falls below the saturation pressure and both gas and liquid hydrocarbons are present within the rock pores, relative permeability controls the GOR of the fluids entering the wellbore. Two-phase flow in the wellbore can cause significant errors for sampling downhole, and the BHSs can show large fluctuations in GOR. Both the surface samples and BHSs can show high GORs typical of a gas/condensate test even though the reservoir fluid is a volatile oil.
API gravity and liquid color can also be used as an indicator of the fluid nature. A schematic of the typical API-gravity and liquid-color characteristics for BHSs and surface samples for a tight-formation DST is shown in Fig. 2. When the FBHP is always above the fluid saturation pressure, then the liquid API gravity from both BHSs and surface samples should be constant.
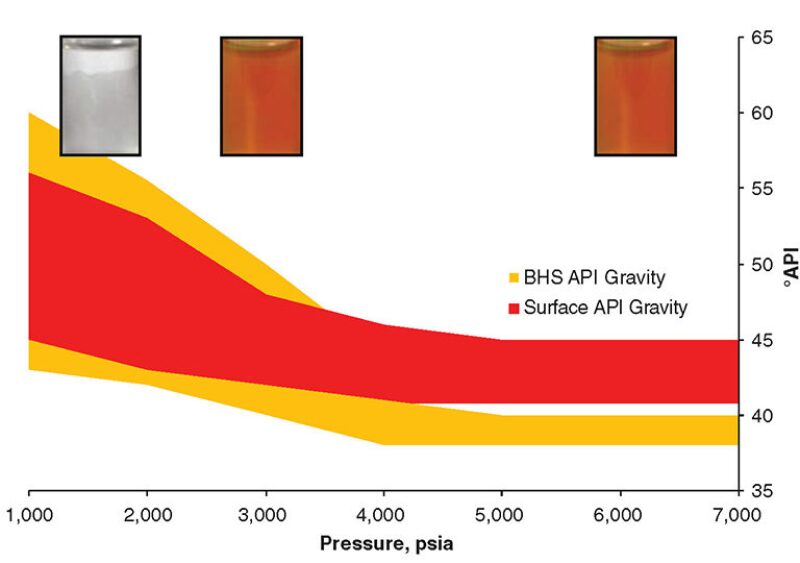
If the produced liquid is colored, this is often taken as an indication that the produced fluid is not a gas condensate. However, the bitumen responsible for liquid color is sometimes found in single-phase gas condensates and in the liquid within the formation for a gas condensate flowing below its saturation pressure.
Methodology for Reviewing Test Results for Tight-Formation DSTs
The methodology consists of two steps: a data-validation and -sifting process, followed by EOS modeling to achieve a coherent replication of well-test data. The objective is to create a model based on likely and reasonable fluid behavior across the test system for all test periods.
Typically, well-test data are gathered from a variety of sources: wellhead and subsurface pressure gauges, tabulated separator flow rates, and contaminant measurements followed by laboratory analyses and pressure/volume/temperature (PVT) reports. Before any modeling can proceed, the well-test data need to be screened for irrelevant or erratic data. Depending on data availability, gas and liquid rates may be averaged over time intervals different from those used for PVT reporting. Composition from both subsurface and surface samples should be included in the data review.
Two contrasting case studies demonstrate how reliable reservoir-fluid compositions were derived from scattered and conflicting data.
Case Study 1
The first case study concerns a lean gas condensate of uncertain GOR. During a multirate DST, a single set of separator samples and downhole samples was collected. The compositions of the recombined surface samples were richer, containing nearly three times the heptanes plus the content of the BHSs.
The well-test data showed significant scatter of GOR during testing as a function of wellhead pressure. The tests comprised several flow periods, with the separator operating at different surface conditions during each flow period. The objective of the study was to determine the correct reservoir fluid and create a fluid model on which to base field development and future sales streams. There were no flowing downhole pressure data.
Following a sifting of the data to select stable flow periods, a reduced set of GORs was used to calibrate the fluid model. The reduced data set shows a clear trend of rising GOR with flow rate, suggesting that condensate dropout in the reservoir was causing a leaner wellstream composition. The separator products were checked for equilibrium conditions and were found satisfactory. The surface GOR at which the separator sample was taken fits in with the general trend of the sifted data. In contrast, the GOR of the BHS departs from the general trend, indicating that it may be unrepresentative.
The excellent match to the early part of the curve where the predicted GOR matches the field GOR before liquid dropout in the reservoir is significant and gives good support for the fluid-model validity. The surface recombined composition is therefore more consistent with the many measured GORs during the test than is the bottomhole composition. The calculated GORs using the bottomhole gas composition are typically 50% higher than the field data, allowing them to be rejected.
A further EOS analysis to assess the data validity is to model reservoir-condition saturation pressures. The predicted dewpoint of the recombined separator sample is much closer to the reservoir pressure than that of the BHS composition. This again supports the case for the separator-sample composition being more representative than the bottomhole composition because gas/condensate reservoirs often have a saturation pressure at initial reservoir pressure. Fluid migration upward to cooler and lower-pressure regions also ultimately leads to the gas/condensate fluid reaching a region where the conditions touch the dewline. At this and any subsequent points in the fluid migration, the gas/condensate will be at saturation pressure.
The combined approach of data selection and EOS analysis enabled the resolution of discrepancies between BHSs and surface samples, provided a good fluid model from which to construct black-oil tables, and used multiple flow periods as calibration data to tune the model for production, creating confidence in future production modeling.
Case Study 2
This study was presented as a gas/condensate fluid with problems concerning fluid characterization and GOR. The tight nature of the reservoir rock and the large pressure drawdown encountered during testing led to difficulties in data interpretation. The surface rates across the different flow periods were highly variable, with condensate/gas ratios (CGRs) ranging between 100 and 540 STB/MMscf and API densities ranging from 42 to 46. BHSs also gave a wide variation in composition. The objective of the study was to make sense of the data and to recommend a reservoir-fluid composition on which to base development plans and export streams.
The well test showed a strong correlation between GOR and gas rate. This suggests the fluid is being produced below its saturation pressure and that a lower FBHP leads to the preferential production of the leaner, more-mobile gas phase. The stock-tank liquid was colored black, also suggesting that the fluid was an oil rather than a condensate.
A PVT study had been performed previously using separator fluids combined at the original CGR of 126 STB/MMscf, which was erroneously believed to be representative of the condensate well producing cleanly. The PVT study showed typical gas/condensate behavior, but with a dewpoint approximately 1,500 psi above reservoir pressure. This was clearly inconsistent with a single-phase-fluid sample and shows that the laboratory PVT fluid was too lean. The laboratory fluid composition was matched to the laboratory PVT data, including dewpoint pressure. This provided the calibration for modeling richer fluids generated mathematically by changing the recombination CGR. The composition was then enriched by CGR adjustment until the tuned EOS model predicted saturation pressure at initial reservoir conditions. This fluid showed volatile-oil behavior, with a predicted GOR of 2,000 MMscf/STB, consistent with the GOR extrapolated from the flow rate. Ideally, the reservoir-fluid density could be compared with that derived from downhole-pressure gradients, but in the absence of such data, the match to extrapolated GOR at zero flow is the best achievable. In this study, the combined approach offered the same benefits as seen in the first case study.
This article, written by JPT Technology Editor Chris Carpenter, contains highlights of paper SPE 164887, “Reservoir-Fluid Characterization From Tests on Tight Formations,” by Brian Moffatt, Michael Fawcett, Jaimar Maurera, and Anna Bruzco, Petrophase, prepared for the 2013 European Association of Geoscientists and Engineers Annual Conference and Exhibition incorporating SPE Europec, London, 10–13 June. The paper has not been peer reviewed.