A comprehensive environmental-monitoring project in the Agri Valley in southern Italy has been developed to ensure continuous management of the environmental effects of Eni’s oil treatment center there. This project is able to control the environmental effects of exploration and production in a large area around the plant (100 km2). It is characterized by a complete integration of several networks, stations, and systems used to monitor simultaneously air quality, noise, odorous emissions in terms of olfactory nuisance, groundwater and soil quality, ecosystems status, and ecological biodiversity.
Introduction
The area where the environmental-monitoring project was developed is characterized by sites that have community-level protection, especially areas protected because of national parks, widespread woods, rivers and streams of high quality, and springs and groundwater of great regional and national importance for the production of safe drinking water.
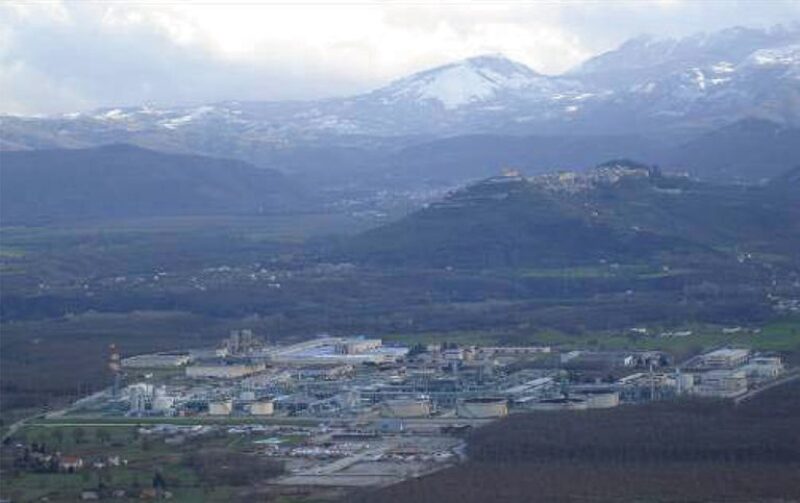
Eni’s oil treatment center in this territory collects the production from 24 oil wells, amounting to approximately 104,000 BOPD (Fig. 1).
The environmental-monitoring plan consists of environmental-monitoring networks on more than 100 km2 at altitudes between 600 and 900 m. The system includes monitoring networks relevant to the following environmental variables:
- Air quality
- Biosystems
- Bad odors
- Noise
- Microseismicity
- Ecosystem
Air Quality
The network consists of four monitoring units placed 2.3–4.8 km from the oil center. The sites were chosen according to a model that predicted the spread of emissions from the oil center. The air-quality-monitoring stations were installed outside the plant to continuously identify the effects that production activities have on the quality of the air and to provide operational warnings to avoid any negative effect on the surrounding territory.
Each unit is provided with computerized instruments, allowing continuous monitoring of the levels of carbon monoxide, hydrogen sulfide, sulfur dioxide, ozone, nitrogen oxides, benzene, toluene, xylene, methane, nonmethane gases, volatile organic compounds, polycyclic aromatic hydrocarbons, and radon, and monitoring of meteorological standards (e.g., wind speed and direction, rainfall levels, humidity, temperature).
The data received continuously from the monitoring units are reported in real time on the Web and in the control room of the plant and are compared continuously with information on pollution standards taken from the chimneys of the oil center.
Biosystems
In close correlation with the air quality, a biomonitoring system focused on lichens has been developed. This does not consist of a direct detection of negative effects on the environment but allows measurement of any changes in the normal conditions of the components of the ecosystems reactive to pollution (in this specific case, lichens). In fact, lichens are specific indicators of biological effects of air pollution. As biological indicators, lichens are a useful instrument to ascertain the effects of pollution, eutrophication, climate change, and forest management.
The ecological variations caused by environmental pollution can appear in bodies at three different levels:
- Morphological or structural variations
- Increase of polluting substances
- Alterations in the composition of animal and plant communities
The aim of the lichen biomonitoring network is to build a permanent pool of survey stations to determine the current conditions of the survey area (with particular reference to the atmospheric component), which will be kept as a reference point for evaluation of changes in the environmental conditions.
To decide the best locations for the network, the territory was divided into 1-km-wide cells. Following that scheme, 33 points in the Agri Valley affected by the presence of the oil center were identified.
The stations of the lichen biomonitoring network are used to determine the following indicators:
- Lichen biodiversity through the application of the lichen biodiversity index, applied to assess environmental quality at the 33 stations
- Bioaccumulation study on elements of environmental importance and toxicological interest in lichen transplants for the use of lichens as biomonitors for traces of atmospheric deposition (a lichen-transplant technique will be used to create detailed maps regarding the deposition of elements and the study of the relevant temporal changes)
Bad Odors
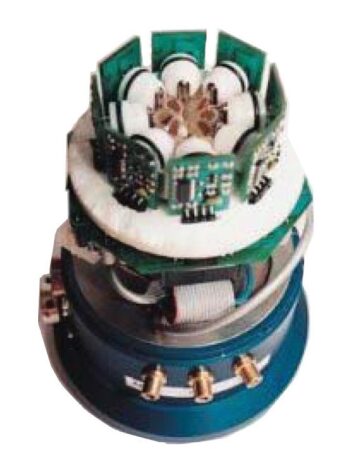
Within the environmental-monitoring plan, it has been the intention to determine potential odors disturbing people living near the oil center. The monitoring activity is divided into two stages. The first stage is to determine the concentration of unpleasant odors in gas samples by using a dynamic olfactometry, a discontinuous sampling method. The second stage, a continuous measuring method, uses an electronic nose (Fig. 2).
The survey method uses a group of people who behave as sensors. Each examiner is trained and chosen according to sensorial and behavioral standards, keeping in mind the limitations of the regulation applied. The method is based on the identification, on the part of a test group, of the threshold of the sample’s olfactory result—that is, the limit within which, after having been diluted, the odor is perceived by 50% of the examiners.
For the malodorous sample to reach said threshold, an olfactometer is used. This instrument is able to dilute the sample of malodorous gas with neutral air, which is odorless, according to precise reports.
Together with the discontinuous-sampling odor monitoring and laboratory analysis, a continuous measuring campaign is conducted with electronic noses. An electronic nose is installed outside the plant next to one of the air-quality-control stations to measure the olfactory effect of the same plant for 2–4 weeks.
Noise
The noise-monitoring system is made up of four measuring stations. Two are placed near the oil center to measure the noise directly related to the activity taking place inside the plant. Two others are placed next to the population centers near the plant. Each station contains a sound meter/analyzer for continuous measurement of the sound pressure level, maximum or minimum sound levels, peak sound pressure, and the noise spectrum. The measurements are taken at a height of 1.5 m from the surface of the station, in normal thermohygrometric conditions, related to the measurement site.
Microseismicity
The network is made up of 14 detection stations distributed in an area of approximately 1500 km2 around the oil center, aimed at monitoring earthquakes with magnitudes less than 3 on the Richter scale. This network is important for the emotional well-being of the neighboring population because it eases concerns about the correlation between earthquakes and oil and gas operations.
The peripheral stations are provided with geophones. The signals acquired in each station are transmitted through a global system for mobile communications phone signal to the data-processing center, which extracts the following information:
- Local earthquakes, those having an epicenter inside the network or less than 10 km from one of the stations
- Regional earthquakes, those having an epicenter 10–100 km away
- Nonregional earthquakes, those having an epicenter more than 100 km away
Ecosystem
Soil, Subsoil, and Underground Water. Soil, subsoil, and underground-water monitoring is conducted to check the quality of the environmental matrix near the plant, to verify any infiltration of pollution, and to monitor the conservation of the territory to ensure sustainability of the oil activities in the Agri Valley.
The characterization of the soil and subsoil matrix is conducted through geological surveys for the local lithostratigraphical reconstruction and through soil samples taken for chemical surveys.
Surface Water and Sediments. The monitoring of surface water and fluvial sediments is conducted with respect to what is foreseen by Italian regulations and, in particular, considering the main water resources present in the area. For each point at which the surface water is measured, two samples are taken, one from the surface and one from deeper.
The monitoring activity allows determination of the quality for each survey period near each water source studied, guaranteeing, in time, continuous control of the characteristic ecological condition of the matrix.
Vegetation. The aim of the vegetation monitoring is to recognize not only the species but also the different types of habitats to which the species are bound for their survival.
A phytosociological method, which studies the geographical, physical, and biological distribution of the vegetable communities and their evolution in space and time, was used to identify and define vegetation habitats. The starting point is that no plant lives in isolation; but, with others of the same species, they create a population. Multiple different species (populations) make up a vegetation community, which presents the biological proof of the features of a certain habitat.
Phytosociology attempts to study vegetation communities (habitat), their distribution, and all the physical and biological relationships characterizing their evolution in space and time.
The method is based on three fundamental principles:
- The vegetation groupings are characterized by a precise floristic composition.
- Among all the species making up a community, some better represent the complex relationship among species, communities, and environment. These are defined by high-frequency differential and common features.
- Said species can be used to form a hierarchical classification of groupings, in which the association is the fundamental element.
The methodology consists of two stages. In the first stage (analytic stage), through the picking of samples, the vegetation communities are analyzed from a qualitative (evaluation of the species present) and quantitative (evaluation of their abundance) point of view. In the second stage (synthetic stage), the different samplings are compared and the syntaxonomical elaboration is conducted, leading to a definition of the typology of the vegetation through the floristic, ecological, and statistical comparison of the samplings.
Macrofauna and Ground Microfauna. The superior vertebrates (birds and mammals) are particularly suitable for monitoring the quality of the environment on a large scale. The ubiquity of both classes, or, better, their adaptation ability in a large range of environmental typologies, allows their use in different conditions. Because they play a very substantial role in the trophic chains (food chains), studying them can provide information about alterations at a superior level (community and ecosystem).
Birds can provide excellent indications of both chemical pollution (as in the case of insectivores and rapacious birds) and alteration of habitat composition and structure (especially forest or ecotonal habitats).
The great amount of some species can supply quantitative indications on the availability of a certain habitat (low-selectivity target species), while other species that are more demanding about the specific composition and structure of the habitat in which they live supply qualitative/quantitative indications on the habitat available (selective target species).
Mammals (with the exception of bats), not having the capacity of bird dispersion, are much more sensitive to habitat alterations because, during their displacements, they can be impeded by the presence of altered environments that isolate still-suitable environments.
Conclusions
The environmental-monitoring project in the Agri Valley allows a continuous management of the environmental effects of the activities of the Eni oil treatment center. This project is unique in the upstream industry and represents a possible turning point in the oil and gas industry because of its capability to control all the environmental effects of exploration and production, especially in an environment with human communities, and because it can demonstrate the oil and gas industry’s commitment to business sustainability.
This article, written by Editorial Manager Adam Wilson, contains highlights of paper SPE 156294, “Innovative Environmental Monitoring for Upstream Onshore Installation,” by Paolo Carnevale, SPE, and Silvia Di Croce, Eni, prepared for the 2012 SPE/APPEA International Conference on Health, Safety, and Environment in Oil and Gas Exploration and Production, Perth, Australia, 11–13 September. The paper has not been peer reviewed.