
Production separators, whether they are two-phase, three-phase, horizontal, or vertical, are the backbone of the upstream facility. The performance of the separator(s) is key for a facility to meet both its export basic sediment & water (BS&W) and produced water specifications, as well as for ensuring that the compression system remains clean and liquids are minimized.
The primary purpose of a production separator vessel (as well as scrubbers, treaters, or slug catchers) is to partition and separate the distinct fluid phases: gas, oil/condensate, and water. The gas stream exiting the separator should have minimal liquids content, the oil stream should have trace amounts of water, and the produced water stream should contain parts-per-million (ppm) levels of oil. In reality, the fluids entering the separator are likely to have additional “phases,” in the form of sand/solids, foam, and emulsion, which could be a water-in-oil emulsion or oil-in-water (OIW) emulsion (referred to as a reverse emulsion). It is these other phases that make separation even more challenging.
The design and layout of the vessel internals can be crucial to the operating performance of the separator and typically include inlet device, baffle plates, coalescing devices, demisting assemblies, instrumentation, and control systems. With the complexity of the different aspects of separator vessels and the type of fluids processed, the troubleshooting of these vessels will require a full understanding of the different elements of the process.
There are many different types of separators operating at a wide range of conditions, which can change significantly over the life of the facility. No matter what the design of the separator—whether it is a more conventional overflow weir-type three-phase, an underflow weir, a submerged weir, or has a plate pack installed—there are a few common reasons behind the majority of poorly performing separators.
Troubleshooting always begins with the holistic assessment of the process train and collection of data, including vessel performance, design, and operational and maintenance data. The accuracy and validity of the data are critical to understanding the root cause of the issues, and identifying options available to address these issues. The techniques discussed here relate to the collection of the data. As the techniques become more detailed, so too do the generated data and potential for misapplication of the technique. The interpretation and selection of the appropriate solutions require a thorough understanding and experience of the fluids, the equipment, and the various production chemistry aspects.
This article will primarily focus on specific operational elements of the troubleshooting rather than the mechanical design of the separators, although it will be referenced.
Performance Targets
A poorly performing separator effectively results in three likely outcomes: excessive liquids in the gas outlet stream impacting the downstream systems (e.g., heat exchangers, compressors, dehydration, and sweetening systems), high BS&W in the oil not meeting sales specification targets, and high OIW that will influence the environmental targets both in onshore or offshore systems. Occasionally two or three of these outcomes may arise together but typically it is one that has developed over time to become a significant issue that must be addressed. Each of these outcomes can have serious knock-on effects, ranging from equipment damage to large losses in revenue.
Common Causes of Upsets
The need to troubleshoot separators normally arises when either the performance has slowly degraded over time until meeting one of the performance targets is no longer possible, or when the operating conditions are no longer within the original design envelope. Examples of potential causes for these changed conditions may include declining oil production but increased water production, or the introduction of a subsea tieback with different fluid properties.
The accumulation of solids within a separator can have a major impact on performance, mainly in regards to OIW and BS&W. The solids can include formation material such as sand or fluid-derived solids such as asphaltenes, napthenate salts, and scale. Often there is a combination. Depending on the type and density, the solids may settle on the bottom, foul internals such as plate packs, or settle at the oil/water interface.
Some production fluids also have a tendency to create foam and form a layer above the bulk oil layer, which can impede the level controls. Many of the production chemicals, and especially interactions between chemicals used, can also exacerbate the foaming tendency. A foam layer is often not detected until liquid carry-over in the gas overloads the compression system.
Overtreatment of chemicals can also have a serious impact on the performance of separators. Often the chemical program sets an injection rate but over time the rate may drift, be slowly increased, or simply not adjusted to match the flow rate of the incoming fluids (constant injection regardless of production rate), thus increasing the effective chemical concentration (undertreatment may also occur due to the same mechanism causing the chemical treatment to be ineffective). Miscommunication between operational shifts is a common cause of this increase in chemical rate. In other systems, depending on how the chemicals partition, they may be recycled and gradually build up in concentration and cause overtreatment. Common chemicals that can be overtreated include demulsifiers, corrosion inhibitors, and water clarifiers. Note that many chemicals will alter the gas/liquid surface tension and/or the viscosity of phases, which will impact separation performance.
The internal design of the vessel will often play a major part in the poor performance of separators at some stage of the production life of the system, due to underdesigning the internals or in some cases overdesigning them or even simply because of inappropriate/poor design. Although not as common as other issues mentioned earlier, damaged/dislodged internals may occur and upset the distribution through the vessel. An example is for slugging (liquid slug or gas pressure wave slug) services or a compressor trip with antisurge routed back through the suction scrubber, where the inlet device may be damaged or completely dislodged if it was not suitably designed to handle the large forces that occur when the slug hits the device.
Poor control and flow instability may also be a cause of upsets within a separation system. Inaccurate level measurement is common, often caused by fouling of the level bridles or simply due to incorrect calibration, and may lead to the separator operating with inappropriate interface levels. The installation of multiple level measurement devices of different types can help identify discrepancies between the actual level and the measured level.
Fluid and Solids Monitoring and Analysis
Before conducting any detailed troubleshooting, it is critical that the performance of the separator is mapped over a period of time that allows the collection of some consistent data to provide a baseline. Ideally, mapping the system performance will have been done as part of the day-to-day operations and include regular BS&W measurement (inlet and outlet), OIW measurement, and solids quantification and characterization. Having this historic data will make the troubleshooting much easier, but often it is not available or inconsistently collected.
System Performance Mapping
BS&W. Measure and compare BS&W of the inlet fluids and the outlet oil stream. It is important to understand if the vessel is helping to break some of the emulsion, or whether it is just separating some or all of the free water. If there is only minimal reduction in the percentage of emulsion, then the vessel, operating conditions, the emulsion-breaking chemical, etc. need to be reassessed.
OIW. Measure the OIW of the water stream. Rather than just obtaining a total hydrocarbon content, identify whether the hydrocarbon content is free oil that easily and quickly separates, or if it is more finely dispersed (or soluble) and difficult to separate.
Oil/water interface. If the separator has sample nozzles at the interface, these should be utilized to determine the sharpness of the interface or if there is a “rag” layer (stable emulsion) and if there is, how thick it is. Collecting a sample and having it analyzed at an onshore laboratory can identify what is stabilizing the emulsion.
Solids content and type. Regular sampling of the oil and water streams using Millipore filters should be done to collect solids and obtain concentration data (total suspended solids [TSS]). The filters should be sent for analysis at an onshore laboratory to determine the composition.
Troubleshooting Techniques
Now that a good understanding of the fluid properties and performance has been achieved, other troubleshooting techniques can be employed to further understand what is actually happening within the vessel. The techniques range from the very simple ones to very sophisticated methods requiring special equipment.
Simple Methods
Vessel/pipe temperature.
The accumulation of solids within a vessel or pipe may be identified by seeing a change in temperature of the vessel wall or pipe. This requires the vessel/fluids to be operating at temperatures above ambient because at temperatures near ambient there is no temperature gradient.The solids effectively act as insulation, and where they have accumulated, the vessel wall temperature will be lower than the fluid temperature. This technique only allows us to see what is close to the wall, not what has deposited toward the center of the vessel or within internals. It is a good starting point though, and extreme changes in wall temperature may indicate significant levels of deposits.Method 1: At lower operating temperatures, using your hand (with gloves for hotter processes), feel along the wall at various heights within the liquid phase to observe temperature changes.
Method 2: Use a handheld infrared temperature gun to measure the temperature along the vessel/pipe, looking for changes in temperature provided the vessel is uninsulated and the sun is not reflecting directly off of the vessel wall.
Thermal cameras. This method is similar to the temperature checks mentioned earlier, except thermal imaging cameras are used that can give full, detailed temperature profiles of the entire vessel provided the vessel is uninsulated and the sun is not reflecting directly off of the vessel wall. This is useful for identifying solids accumulation but normally tells us little about the fluids. For some systems (heavy oil) where there are significant differences in the heat capacities of the fluids, the fluid phases will be at different enough temperatures to be defined by the camera.
Vessel sample points. Some vessels have a series of sample points (such as taps, tri-cocks, profiler) located near the oil/water interface of the vessel. These can be used to identify exactly where the interface is and correlated to the level transmitters. The contents of the sample can also be used to determine the extent of the emulsion within the vessel and the effectiveness of the demulsifying chemical(s).
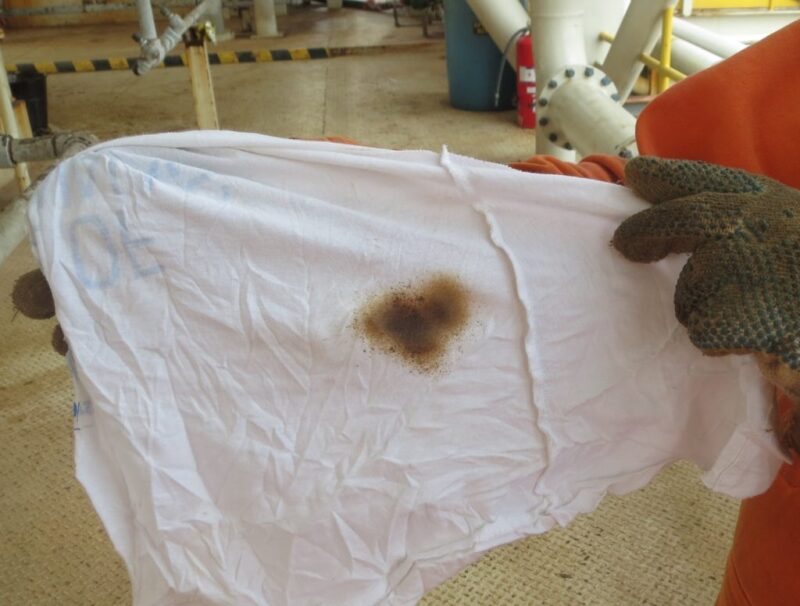
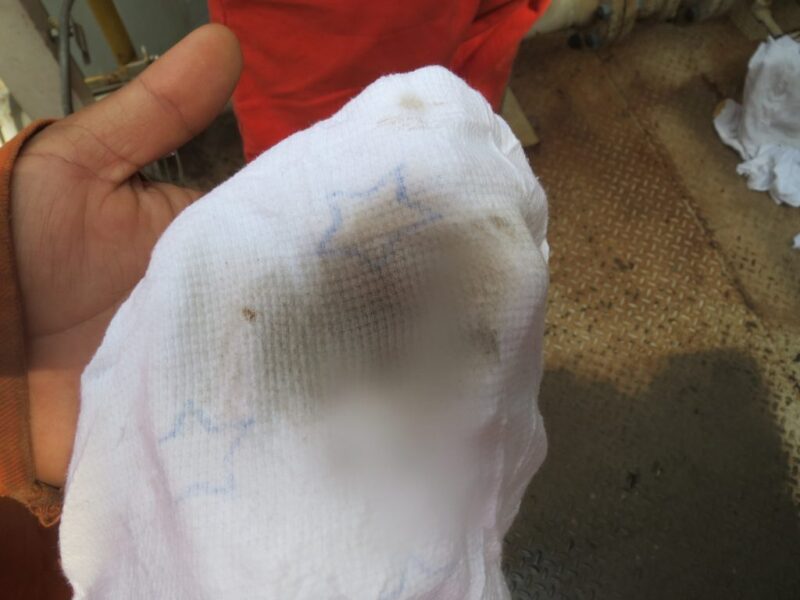
White rag. A white rag test is a simple test for determining if there is liquid carry-over into the gas phase out of the separator. It consists of locating a bleed off of the gas line from the separator, placing a white rag in front of the bleed, and opening the bleed valves. Clean gas streams with little carry-over will show minimal discoloration and remain dry, whereas significant liquid carry-over can result in the rag becoming wet and with large dark (oil) stains (for crude oil systems; condensate systems will not have the same discoloration).
NOTE: There are a number of safety issues when conducting this test. All appropriate personnel must discuss and approve of the test before it is conducted. The test will release gas to the atmosphere and may expose the person to hot fluids (depending on operating temperature).
Millipore filters. If not already done as part of routine operations, the collection of solids from various process streams using Millipore filters provides critical information on the solids in the system. By measuring the fluid volume filtered over time, the solids concentration or TSS can be determined. The collected solids can then be analyzed to determine the type of solids. Knowing whether the solids are fluid- or formation-derived or a combination is crucial to identifying the most appropriate means of dealing with the solids.
Flow distribution. For vessels with multiple outlets for one of the separated phases such as an electrostatic treater, clamp-on flowmeters can be used to measure the water flow from each leg provided the placement meets the meter requirements (not near an elbow in a straight run section). Differences in flow rates indicate maldistribution within the vessel, which may be attributable to solids deposition and/or fouling of the distributor or a poorly designed vessel with inadequate separation length for the inlet flow rate and properties.
Pressure drop. Solids deposition and fouling often results in increased pressure drop through pipework and equipment. Monitoring and trending the pressure drop through certain sections of the process, such as heat exchangers and mist eliminators, allows early detection of fouling and the planning of maintenance activities and further troubleshooting to be undertaken to identify the cause of the fouling.
Moderate Methods
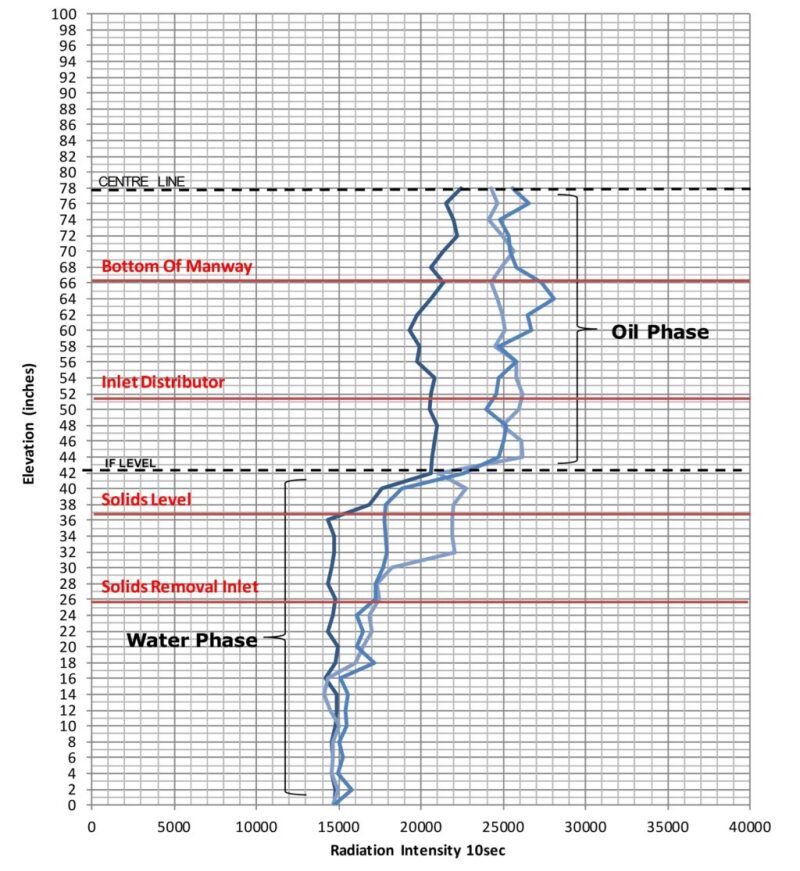
Neutron backscatter scan. This technique involves using specialized equipment and is normally contracted out. The equipment is used to scan the vessel in the liquid sections and can be used to build a profile of what is on the vessel wall, whether it is solids, water, emulsion, or hydrocarbon. An example of the output from a scan is shown in Fig. 3. By scanning at various locations along and around the vessel, a level profile can be developed. This typically can only see into the vessel ~6–12 in. but can provide a more accurate profile than the temperature scan. Note that this technique uses radioactive material that has specific safety requirements.
Gamma scans. This is similar to the neutron backscatter, except it can also be used in the gas phase and penetrates further into the vessel. The equipment uses different radioactive sources and detectors and can see a little further into the vessels. This is useful for detecting whether there is foam present above the oil layer, when carry-over issues may be present or there are concerns about the level control. As with neutron backscatter measurement, gamma scans use radioactive material that has specific safety requirements.
Dyes. In water treatment systems, the injection of colored dyes upstream of certain equipment can be used to determine residence times. The length of time the dye takes to leave the system can also provide an indication of how much mixing is occurring. Although this does not show what is happening within the vessel, it does allow a comparison to be made with the theoretical residence time and, if necessary, further investigation can be conducted. Note that the dye selection needs to consider where the fluids will ultimately end up (e.g., if the water is discharged to sea).
Chemical trials. Chemical trials are commonly conducted when there are issues with the separator and improvements are believed to be possible with changes to the chemical program, whether by optimizing the rate of the incumbent or trialing a new chemical. When conducting these trials, the monitoring and analysis are critical. Small changes in rate while maintaining steady operation and flows is required to be certain of the impact the changes to the chemicals are having. Be sure to allow enough time for the old chemical to leave the holdup volume of the vessel and for the new chemical concentration to build up before drawing any conclusions.
The use of neutron backscatter or gamma ray scans can aid in the trials of certain chemicals. For example, conducting gamma ray scans while trialing defoamers can identify actual changes in foam levels within the vessel, rather than relying on simple white rag tests and monitoring the levels and contents of the compressor scrubbers.
Online measurements. There are a number of online measurement devices that can be used to trend equipment performance, including OIW, BS&W, and particle size.
OIW and BS&W measurement devices are common and can help in day-to-day troubleshooting. Long-term trends can be used to identify declining performance of a system or a specific equipment item. These devices are heavily reliant on regular cleaning and calibration in order to obtain reliable data.
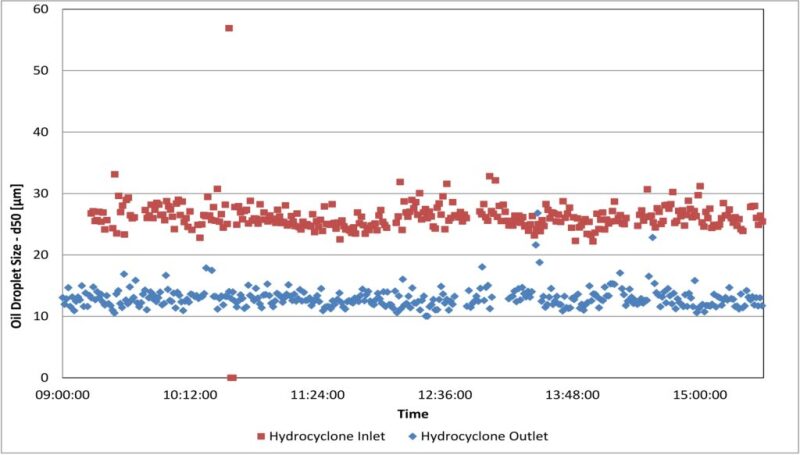
Particle size measurement is typically done using specialist equipment that is temporarily hooked up as a side stream at a location in the produced water system. The device(s) measure both oil droplet and solids particles in a water stream and can be used to determine the quantity and the size distribution. Obtaining droplet size distributions through a produced water system allows the performance of the treatment equipment to be more accurately assessed as opposed to single point sampling and laboratory analysis. Fig. 4 is an example showing the reduction in oil droplet size across a hydrocyclone. This method can be used to accurately assess the water quality out of the separator. Proper setup of the equipment and planning of the activities including organized plant/equipment trial are vital to obtaining both representative and valuable data.
Computational fluid dynamics (CFD). The use of CFD modeling has become more prevalent as computing power has increased and costs have reduced. Where a system or a piece of equipment may be underperforming, CFD modeling may be used to help identify anomalies in the vessel, whether it is maldistribution caused by internals or possible blockages. The advantages of CFD vs. some of the more advanced techniques are that it does not require offshore time or the use of hazardous materials.
Advanced Methods
Tracers.
Gas-, water-, and oil-soluble tracers are available to allow troubleshooting of each phase throughout the vessel; they can be used to get actual residence time, look at flow paths through the vessel, and estimate carry-over/carry-under (all phases).By placing detectors at specific locations along and around the vessel, the flow paths through and around internals can be determined. Usually tracers for both oil and water phases are used when looking at liquid separation issues (Fig. 5).
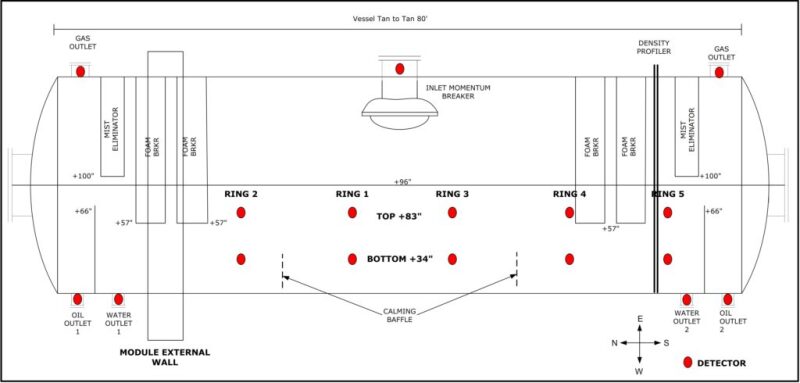
The detectors on the inlet and outlet pipes allow the actual residence time to be determined.
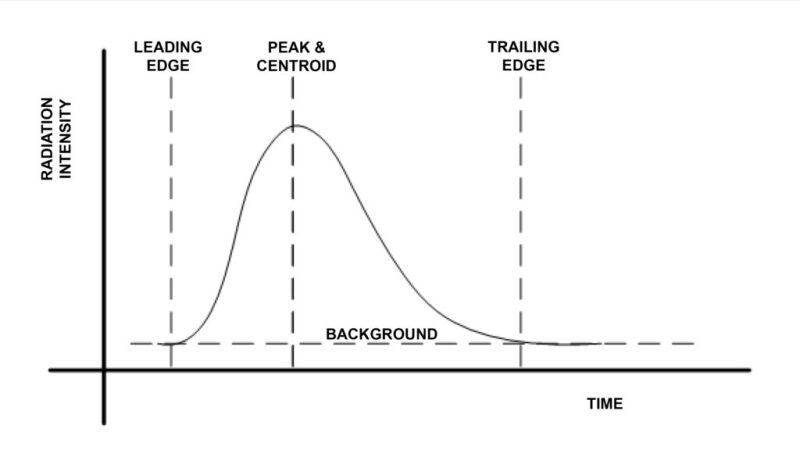
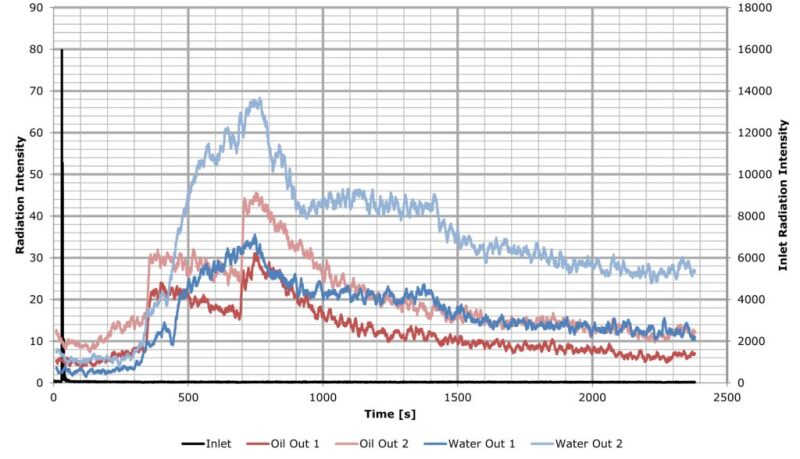
For plug flow, the intensity should have a large peak and short tail with the peak being close to the theoretical residence time (Fig. 6). If the intensity takes longer to drop off, it indicates there is no plug flow and it is likely to be remixing. This can be seen in the example shown in Fig. 7, which are the results of a series of water- and oil-soluble tracers for the vessel shown in Fig. 5. The lines show the intensity of the water- (blue) and oil-soluble (red) tracers passing through the two water outlets. All tracers have the initial detection close to the theoretical residence time, but the tracer continues to leave the vessel for a long duration after, particularly for Water Outlet 2.
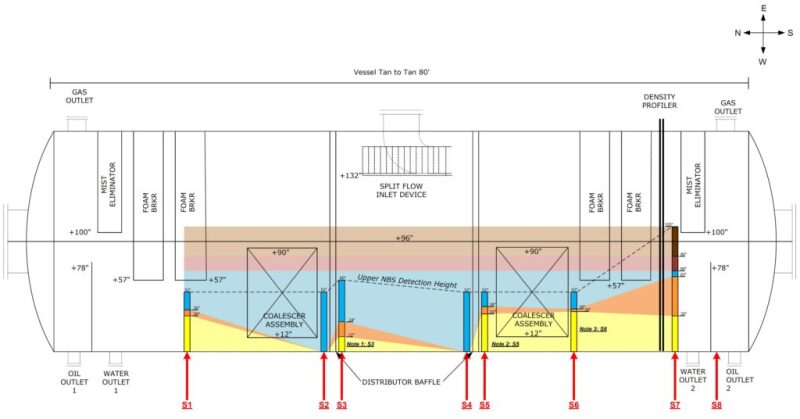
Similar intensity profiles are developed for each of the detectors. These can then be used to understand what is happening in the vessel in terms of fluid flow paths. And by combining this with other techniques such as the neutron backscatter scans, temperature scans, flow rates, and knowing the internals configuration, a more detailed picture of the vessel operation can be developed (Fig. 8). This information can then be used to plan maintenance activities and determine if modifications are required.
Conclusion
A number of techniques ranging from simple tests to advanced diagnostics are available to troubleshoot separators. Selection of the appropriate technique(s) first requires a thorough understanding of the process, fluids, current and historic performance, and the vessel itself. Often a combination of different troubleshooting methods will provide the clearest picture of what is actually happening within a process and allow the root cause to be identified.

Graeme Smith is a process engineering consultant who has spent the past 5 years working for Maxoil Solutions on a range of upstream projects throughout North America, North Sea, South America, Africa, Middle East, and Australia. Projects included concept development for new offshore facilities, troubleshooting and optimization of oil/water separation processes and equipment, through to design reviews and provision of operator training. Before joining Maxoil, he spent 5 years working in Aberdeen, Scotland, providing process engineering support for offshore assets and the front-end engineering design for the construction of a new North Sea facility. Smith holds a bachelor’s degree in chemical engineering from Monash University.
The author would like to thank members of the SPE Separations Technology Technical Section (Robert Chin, Peggy Lane, Victor van Asperen, Jimmie Riesenberg, and Bryan Arciero) for their contributions.