
The objective of this article is to estimate the long-term energy mix—i.e., the combination of resources including solids, liquids, and gases that will satisfy energy demand to the year 2040—with a Global Energy Market model (GEM). The GEM provides a close match of the historical energy mix dating back to the year 1850 and is then used to make forecasts for the future. Originally developed in 2007, the GEM was used at that time to project the energy mix to the year 2030.
The GEM estimates the fractional contribution of different primary energy sources to the global market. In total, there are six parameters that allow the GEM equation to give the best possible match of the historical energy mix. Using the estimated parameter values, the model can then be extended into the future.
The original GEM findings from 2007 presented a “2030 1/3 forecast,” indicating that solids, liquids, and gases would each occupy a third of the energy market in the year 2030. After further disaggregating the categories, it was found that liquids, mostly oil, would experience a declining market share by 2030 while natural gas would see a rapid rise. The solids’ share, mostly coal, was relatively flat by that time.
This article uses the most recent statistics of the last 10 years on consumption of different energy sources to verify the accuracy of the original GEM projections carried out in 2007. Once the results are proven reasonable, a new projection is developed with an extended time horizon to the year 2040. Our findings show continued penetration of natural gas in the energy mix—a result consistent with efforts to reduce carbon emissions.
Introduction
Our work on the energy mix begins by analyzing the historical period back to 1850. At that time, following the industrial revolution, approximately 80% of the global energy needs were satisfied by wood, agricultural residues, and animal dung, with the remainder attributed to coal. The decades that followed saw a significant increase in coal consumption, given its energy density of over three times that of wood. The coal share reached a peak around 1912, with a contribution accounting for 70% of the total, while the market share of wood and the other solids had decreased to 22%. The oil industry was born in the late 19th century, and by 1920, oil had captured approximately 10% of total global energy demand. The oil share peaked in the 1970s at 50%, having never reached the heights of wood or coal. In the same decade, natural gas use was on the rise, reaching a market share of 19% by 1980. Meanwhile, coal’s share had stabilized at 26% after decades of continuous decline. The balance, some 5%, was composed mostly of hydroelectricity and nuclear energy.
In 2015, the contributions of coal and natural gas were around 29% and 24%, respectively, with oil at approximately 33%, and the balance of 14% consisting of hydroelectricity, nuclear, wind, and other minor sources (BP 2016).
Global Energy Market Model (GEM)
The GEM is an integrated methodology based on geoscience, petroleum engineering, economics, and finance.
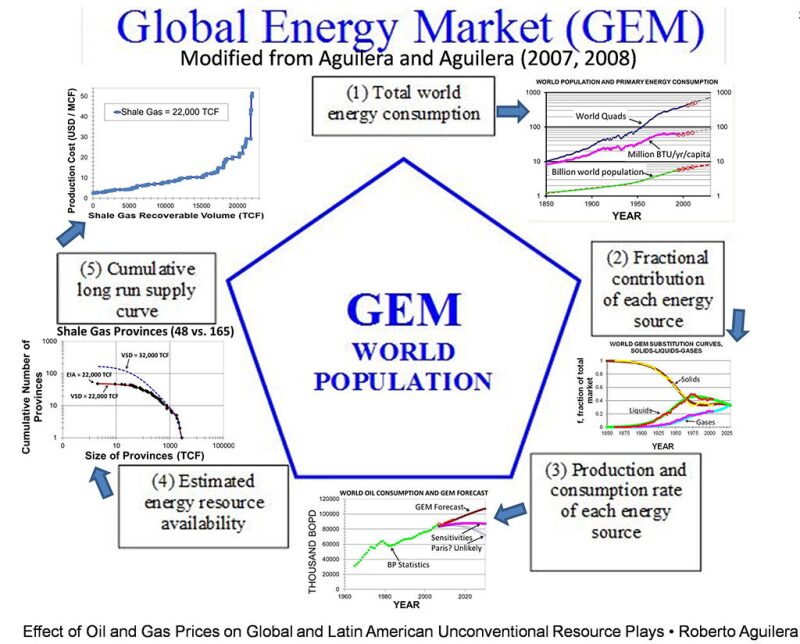
Thus, it is different from methodologies commonly available in the literature that deal with these topics independently. Fig. 1 describes the philosophy of the GEM model using a pentagon. In the center of the pentagon and at the heart of the GEM is the global population, which has been increasing rapidly since 1950.
The upper curve within the small figure at the top of the pentagon (corner 1 in Fig. 1) shows historical energy consumption and forecast future energy consumption. Corner 2 shows the historical and future fractional contribution of solids, liquids, and gases. Analysis of this corner is the main subject of the present paper. Corner 3 shows an example of past and forecast consumption rates of oil, including an unlikely scenario that would be consistent with implementation of the Paris agreement (requiring “global emissions cuts of some 30 percent already by 2035 compared with 2011 levels”, in turn requiring reduced production to “around 60 MMbopd” as indicated by Aguilera and Radetzki [2015]). The same type of graph presented in corner 3 can be prepared for each energy source. The question is whether there are enough volumes of oil, gas, and other resources to supply the rates forecast in corner 3. This is answered in the next corner (4) that shows estimated resource availability (in this example from shale gas reservoirs) by plotting size of provinces vs. the number of recognized provinces with shale gas around the world. The estimate is carried out with a variable shape distribution (VSD) model developed by Aguilera (2006). The final corner (5) of the pentagon shows a cumulative long-run supply curve that estimates the production costs of the world’s energy resources (shale gas reservoirs in this example).
2007 GEM Projections vs. Available Data From the Past 10 Years
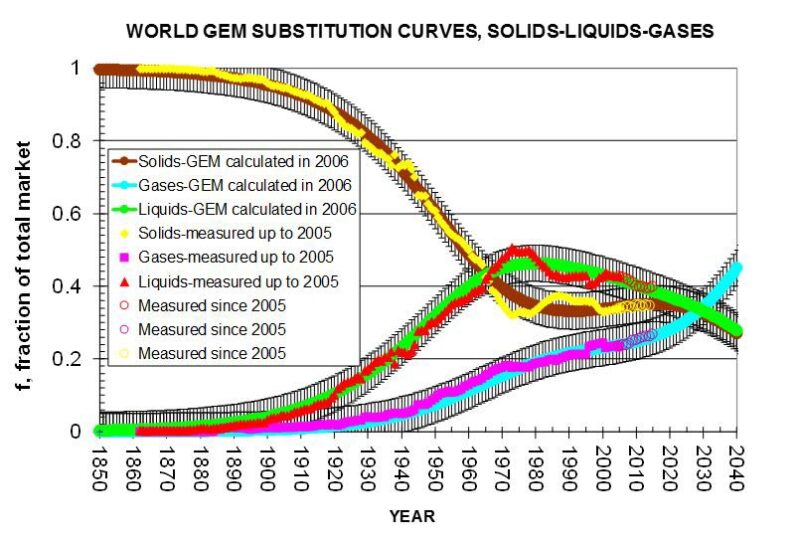
Corner 2 of the GEM pentagon in Fig. 1 shows a crossplot of real and calculated substitution curves for global solids, liquids, and gases. The solids/liquids/gases type of crossplot was introduced originally by Hefner III (2002). The solids include animal dung, wood, agricultural residues (traditional biomass), coal, and uranium (nuclear). The liquids include oil and hydropower, and the gases include initially methane, and later, renewable sources like solar and wind.
The theoretical curves (smooth lines) in Fig. 2 and their matching of the real data (broken lines) were published by Aguilera and Aguilera (2007, 2008). For all three cases, the comparison between actual and calculated values was good, as confirmed by the coefficients of determination (R2) equal to 0.99. The intersection of the three smooth lines in 2030 led the authors to introduce the “2030 1/3 forecast,” indicating solids, liquids, and gases would each occupy one-third of the market in 2030. It has been 10 years since that forecast was made.
In the present paper, the validity of the original projection has been tested favorably against the past 10 years of available data (2005 to 2015), as published by BP (2016). The data from the past 10 years are represented by open circles in Fig. 2 The comparison is accurate, meaning there is no need to modify the “2030 1/3 forecast” at this time.
The graph also shows the projection extended to the year 2040. Vertical error bars with constant values of plus and minus 0.05 show the closeness of the match starting in the year 1850 all the way to 2015. The GEM extension to the year 2040 suggests that, beyond 2030, gases will dominate the global energy market with more than 1/3 of the global energy market while liquids and solids will each contribute less than 1/3.
Environmental Quality
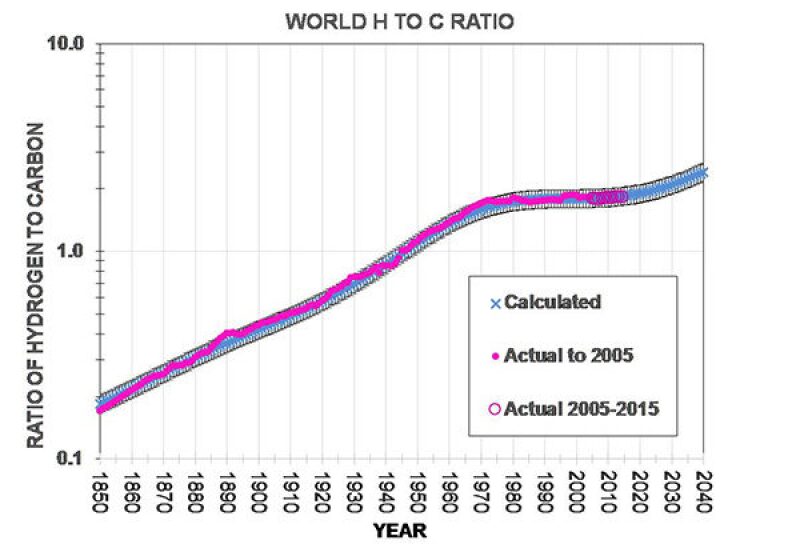
The hydrogen to carbon (H/C) ratio has previously been used as a proxy for environmental quality (Marchetti 1984; Gruber 2004; Aguilera and Aguilera 2007, 2008). The GEM model was used to calculate the H/C ratio shown in Fig. 3. The calculation was carried out using the fractional shares of wood, coal, oil, and gas starting in 1850, and the following average H/C ratios: wood 0.10, coal 0.5, oil 2.0, and gas 4.0. The comparison of actual and calculated data between 1850 and 2005 is good (R2 = 0.99). Data for the years 2005–2015 (BP 2016) are represented by open circles in the figure, and the theoretical curve is tested favorably by the real data.
The graph shows continuous decarbonization from 1850 to 1970, which means an increase in the amount of hydrogen burned as a percent of fossil fuels. At this point, the H/C ratio becomes approximately constant.
We hypothesize that the flattening of the curve is the result of government interventions, particularly related to gas price regulations. However, the model suggests a slight improvement in the H/C ratio due to increasing gas usage as we advance toward the year 2040. This decarbonization will help to advance environmental and economic sustainability (Aguilera and Aguilera 2012). Vertical error bars (10%) highlight the good quality of the match.
Discussion
The projected rapid growth of natural gas is based on its many benefits relative to other fossil fuels: wide geographical distribution, affordability, and environmental benefits. In addition, there is an abundance of gas resource endowments. Apart from the vast conventional gas resources of the world, there is huge potential for unconventional sources including tight gas, shale gas, and coalbed methane.
The impact of low oil prices on the energy mix warrants some discussion (Aguilera and Radetzki 2015). Low prices will have the greatest repercussions for those sources that compete with oil in its major end use of transportation, e.g., biofuels.
The low oil price is unlikely to slow the market penetration of natural gas that is forecast by the GEM, since expanding global gas production and trade will likely depress gas prices as well and thus boost demand. In addition to increased use of natural gas vehicles, there will be ample space for natural gas in the electrical, industrial, residential, and petrochemical sectors.
Nuclear energy and renewables, which are often promoted for the purpose of climate stabilization and energy security, are used primarily to generate electricity. Oil is unlikely to regain market share in electricity, so it is not expected that low oil prices will have a significant impact on renewable and nuclear use in that sector. However, efforts to develop these sources could become costlier in consequence of the spreading unconventional gas production that will bring lower gas prices.
Developments in the US provide a preview of the gas and coal competition that is likely to spread around the world. The low natural gas prices that resulted from increased supply in the US led to a sizable shift from coal to gas in the electrical power sector. This has reduced US CO2 emissions to levels not seen since the 1990s. If the world follows the pattern indicated by the US, then coal producers around the world will face sharpened competition from gas and similar emission reductions could then be expected.
An extended version of this paper was presented as SPE 185579 at the SPE Latin America and Caribbean Petroleum Engineering Conference (LACPEC), held 17-19 May 2017, in Buenos Aires, Argentina.
References
Aguilera, R.F. 2006. Assessing the Long Run Availability of Global Fossil Energy Resources, PhD Dissertation, Colorado School of Mines.
Aguilera, R. F. and Aguilera, R. 2007. Assessing the Past, Present, and Near Future of the Global Energy Market, SPE paper 110215-PP presented at the Annual Technical Conference and Exhibition held in Anaheim, California, USA. 11–14 November.
Aguilera, R. F. and Aguilera, R. 2008. Assessing the Past, Present, and Near Future of the Global Energy Market, J Pet Technol 60 (5): 36–39.
Aguilera, R. F. and Aguilera, R. 2012. World Natural Gas Endowment as a Bridge Towards Zero Carbon Emissions, Elsevier Technological Forecasting & Social Change 79 (3): 579–586.
Aguilera, R. F. and Radetzki, M. 2015. The Price of Oil. Cambridge University Press, Cambridge, UK.
BP Statistical Review of World Energy. 2016. British Petroleum, United Kingdom.
Grubler, A. 2004. Transitions in Energy Use. Encyclopedia of Energy Vol. 6, 163–177. Elsevier Science.
Hefner III, R.A. 2002. The Age of Energy Gases in the New Millennium. The GHK Company, Oklahoma City, Oklahoma. Based on presentations at 10th Repsol-Harvard Seminar on Energy Policy in Madrid, Spain, June 1999, and the SPE Gas Technology Symposium in Calgary, Canada, 30 April 2002.
Marchetti, C. 1985. Nuclear Plants and Nuclear Niches: On the Generation of Nuclear Energy During the Last Twenty Years. Nuclear Science and Engineering 90 (4): 521–526.

Roberto Aguilera is professor of petroleum engineering and CNOOC Nexen Chair in the Schulich School of Engineering at the University of Calgary (Canada). He holds a petroleum engineering degree from the Universidad de America in Bogota, Colombia, and MEng and PhD in petroleum engineering from the Colorado School of Mines. He is the 2011 SPE Canada Regional Distinguished Achievement Award recipient for Petroleum Engineering Faculty. He has lectured, presented his course entitled “Naturally Fractured Reservoirs” and has rendered consulting services in more than 50 countries throughout the world. He is the author of the book Naturally Fractured Reservoirs (PennWell). He may be reached at r.aguilera@ucalgary.ca.

Roberto F. Aguilera is an adjunct research fellow with Curtin University, Australia. From 2013–2017, he was an analyst with the OPEC Secretariat, Vienna, and a co-author of their annual World Oil Outlook. Previous affiliations include IIASA, University of Vienna, Catholic University of Chile, and Servipetrol. He has participated in numerous energy studies, including with the World Petroleum Council and US National Petroleum Council. He holds PhD and master degrees from Colorado School of Mines and a bachelor’s from Haskayne School of Business, University of Calgary. His publication record comprises The Price of Oil, a book published by Cambridge University Press (2015). He may be reached at r.aguilera@curtin.edu.au.