Once a horizontal well is hydraulically fractured, the next step is to clean up the well by flowing it back to remove water and loosen proppant from the wellbore.
Most shale producers in North America have given little thought to this flowback stage and see it merely as a prelude to the cash-flow generating production stage. However, a few companies have come to realize it represents a valuable opportunity to learn more about their wells in a week or two than their competitors are learning after several months of production.
Essentially, flowback data is a bridge between what happened during a completion and what will happen as hydrocarbons are produced. An important driver shared by all the interested producers is that for the most part, they are already required to record the flowback stage per US and Canadian regulations.
“So arguably, the cost of collecting this data is nil,” said James Crafton, president of consultancy firm Performance Sciences, who has been working with service companies and shale producers on different flowback issues for more than 15 years.
Crafton and others involved in this area have long been trying to convince the shale business that how a well is flowed back is often as important as the completion itself and that by ignoring this maxim, they are leaving money on the table. “It is that simple,” he said. “The frustration for me is that the data is there. We have the data, but nobody has the time or perceives the value to interpret the data.”
But there are a few outliers crunching the numbers. Companies including Devon Energy are using the early production and flowing pressure data of flowback fluids to establish their production benchmarks. Nexen Energy is among those also using flowback data to quickly screen the effective size of fracture designs, determine key reservoir properties, and to predict long-term production. Ongoing flowback research is looking at the chemical makeup of flowback fluids to see what else can be learned about shale reservoir behavior.
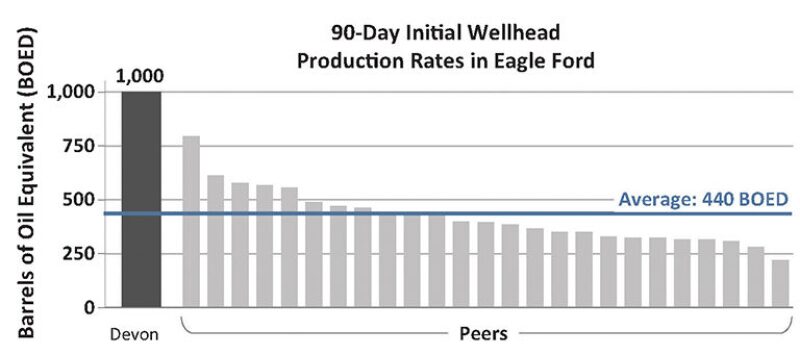
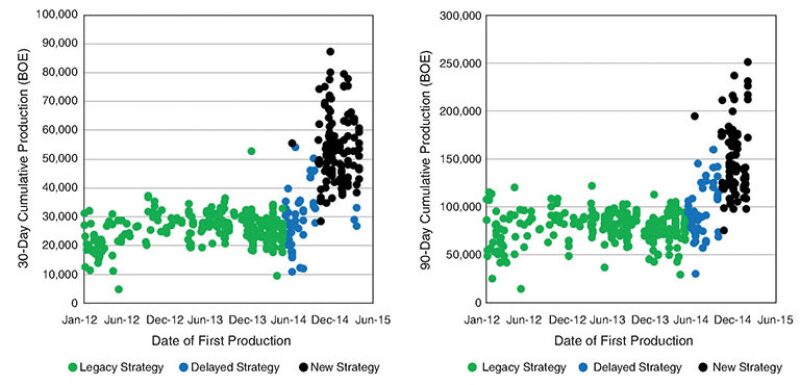
At the Black Hawk field in Texas, Devon reports that flowback analysis has led to remarkable improvements in early production. Located in the heart of the Eagle Ford Shale’s oil and condensate window, the company acquired its acreage there in 2013 and has since doubled the 30-day initial production rates to 1,950 BOEPD. In that same span, the 90-day rates increased by 87% to 1,000 BOEPD—the highest figure in the continental US, and 125% higher than the industry average in the rest of the Eagle Ford, according to Devon.
Like all shale producers, the company high grades its acreage, meaning that the lower performing wells from 2013 were actually drilled in better rock than the ones drilled since. Its completion strategy has not changed that much either.
The big differences in the initial and 90-day production rates have resulted from using flowback analysis to devise a new approach to choke management.
“I would challenge that if there is any completion technique or technology that resulted in this kind of production uplift, we would be up here talking about that technology vs. the production strategy,” said Toby Deen, an operations engineer with Devon, during a presentation at the recent SPE Annual Technical Conference and Exhibition in Houston.
And even though the most effective flowback analysis strategies require the use of high-rate data gathering systems at the wellhead, the capital investment remains modest compared with other diagnostic technologies. For instance, downhole fiber-optic systems cost about USD 1 million per installation and microseismic surveys may run between USD 2 million and USD 5 million, which is why their use is typically limited to a select number of pilot wells.
“Obviously, flowback analysis is cheaper and simpler than other techniques,” said Hassan Dehghanpour, an assistant professor at the University of Alberta (UA), who is conducting research with a consortium of Canadian shale producers. “The whole idea is that we have this data that people measure after opening the well, but we need to have a representative model to integrate the data.”
The models developed so far by Dehghanpour and others are capable of forecasting a well’s production based on just the first few days of flowback. These serve as critical early warning systems for multimillion-dollar developments. After a well is fractured and starts flowback, producers can input the data and quickly generate a ballpark figure to determine whether early well designs will be profitable, breakeven, or losers.
If the numbers look bad, a producer may need to adjust the fracture treatment. And while not all changes will yield higher production, they could improve the economics.
“If you know that pumping in more water during fracturing does not necessarily give you more effective fractures, then you can cut back on that cost,” said Obinna Ezulike, a research assistant at UA, who is also working with the consortium.
As beneficial as flowback analysis is, it is not threatening to disrupt the other more expensive diagnostic technologies. Rather, Ezulike said, it should be seen as another effective tool that companies can widely apply to improve fracture designs. “Unconventional reservoirs are a hard instrument to play,” he said. “There is so much uncertainty everywhere, so you need a complementary analysis using all that you can get.”
Devon’s Flowback Strategy
It is important to emphasize that Devon is using flowback analysis to speed up initial production, not to increase ultimate recovery. From the company’s perspective, the sooner high volumes of hydrocarbons are extracted from its wells, the sooner they turn a profit.

“The capital investment is already in the ground,” explained Deen. “So our goal with flowback is to maximize our time-sensitive economics without cratering the well.”
Devon refers to its strategy as both managed drawdown and choke management. The basic idea is to use chokes at the wellhead to maintain as much bottomhole pressure as possible, which delays fractures from closing and keeps oil and gas flowing up to the surface on its own for a longer period. This also mitigates the production that may be lost from unwanted, but very common events such as a “frac hit” suffered during the completion of an offset well.
If the choke strategy is too aggressive, then too much lifting pressure is lost, which cuts into a well’s recovery factor and may lead to a wellbore collapse. With that in mind, almost all shale producers use a conservative method that relies on predetermined schedules for graduating choke sizes to reduce the risk of damaging the well.
Devon says its unique approach is to ditch these schedules and instead use near real-time flowback and production monitoring to predict when well damage will occur, and then respond by increasing the choke size.
With this approach, tiny changes reap huge rewards. When it first tested this strategy, Devon changed the choke size in one well from 14/64 in. to 20/64 in. and the production rate nearly doubled.
The company also developed a system to adjust the chokes in just a few seconds compared with the old system that required a well to be shut in for half an hour or longer. Devon is now exploring ways to implement similar flowback analysis and choke management programs across the company.
Initial Production or Increased Recovery?
In general, the practice of managing flowback to protect a fracture job in a horizontal well is not new. Gas producers working the Haynesville Shale, a relatively soft formation in Louisiana, learned several years ago that managing the release of flowback often meant the difference between a live well and a dead one.
Crafton, who is also an SPE distinguished lecturer and author of several SPE papers on flowback, coined the term “slowback” to describe how his clients in the Haynesville managed to overcome their early failures. While working for an operator there, he found that crews were being paid bonuses to get the flowing surface pressure of gas wells from 1,000 psi to 2,000 psi down to the line pressure of 300 psi within 36 hours.
“I started looking at the production histories and you could see these were awesome completions,” he said. “But when they would impose that enormous pressure drop, the wells were ruined.” The trick was to slow down the flowback stage, he said. This practice of slowback became widely adopted by major players in the Haynesville that have credited it with increasing ultimate recovery rates by 5%.
Crafton believes this type of flowback management that maximizes recovery will deliver much greater value to the shale business than the strategies that drive up initial production, something he acknowledges may be more attractive to a producer’s investors.
“A gentle flowback results in high [estimated ultimate recovery],” and a lower risk to well damage Crafton said. But the downside is that slower flowback means a lower short-term rate of return. “So it’s all about company philosophy,” he said.
Future Planning With Flowback
Flowback analysis is also an integral part of Nexen’s development plan at its Horn River Basin acreage located in the northernmost area of British Columbia, Canada. Operating in this part of the country presents logistical issues due to the extreme environment. As spring temperatures rise and the winter ice thaws, the ground becomes too soft for drilling rigs to move around easily.
This leaves Nexen with a narrow window of opportunity to drill and complete wells while the ground is still frozen. It also leaves little time for the trial-and-error process involved with identifying the best completion designs. Claudio Virues, a reservoir engineer at Nexen, explained the situation: “If we are spending money next year, our optimization decisions have to come 9 months before that—and we are talking about 100-million-dollar decisions.”
So the old way meant that the company had to wait up to 6 months to obtain enough production data to make changes on the following year’s well designs. With flowback data, the cycle of data acquisition to decision making is shortened to 2 months or less, which allows changes to be made in the same drilling season.
Some of the changes Nexen has made based on flowback data include determining the optimal number of stages needed in a lateral section and in which wells to use less proppant while getting the same production results as older offset wells. It has also helped detect when infill and parent wells are communicating, and if so, how to space them for optimal reservoir drainage.
Nexen’s overall Horn River development plan is to tap into three different shale layers using pads with as many as 20 wells. Virues said the company is looking into how flowback analysis may help engineers figure out the best way to do that. “You have to have an understanding of which formation you are going to flow back first, and how that is going to impair production,” he said. “Is it the bottom one, the middle one, or the top one, and why?”
The company is studying several other ways to leverage flowback data. One of them involves analyzing the chemistry of flowback fluids to quickly determine how fractures are performing. Nexen is working on this and other aspects with UA as part of the consortium that includes Encana, Cenovus Energy, Athabasca Oil, FMC Technologies, and Trican Well Services.
For Further Reading
SPE 119894 Modeling Flowback Behavior or Flowback Equals “Slowback” by J.W. Crafton, Performance Sciences.
SPE 174831 Maximizing Well Deliverability in the Eagle Ford Shale Through Flowback Operations by T. Deen, J. Daal, and J. Tucker, Devon Energy.
SPE 175143 Flowback Fracture Closure: A Key Factor for Estimating Effective Pore-Volume by D.O. Ezulike, O.A. Adefidipe, Y. Fu, University of Alberta, et al.